In August, the trade deficit was at the lowest level of this year
In August, exports from Estonia amounted to 1 billion euros and imports to Estonia to 1.1 billion euros at current prices. The trade deficit was 80 million euros (in August 2015, it was 108 million euros).
The top destination country of Estonia’s exports in August was Sweden (17% of Estonia’s total exports), followed by Finland (16%) and Latvia (10%). The biggest increase occurred in exports to Mexico, Finland and Germany (up by 33 million, 19 million and 14 million euros, respectively). Compared to August 2015, more electrical equipment was exported to Mexico, more mechanical appliances, optical appliances, wood and articles of wood to Finland, and more electrical equipment and miscellaneous manufactured articles to Germany. The biggest decrease occurred in exports to the Netherlands.
The biggest share in Estonia’s exports in August was held by electrical equipment, followed by miscellaneous manufactured articles, wood and articles of wood, and mineral products. The increase in exports was greatly influenced by the exports of electrical equipment (incl. communication equipment), miscellaneous manufactured articles (incl. prefabricated buildings of wood) and transport equipment (incl. motor cars). There was a decrease in the exports of mechanical appliances.
The share of goods of Estonian origin in total exports was 71% in August. Export growth was influenced the most by the exports of goods of Estonian origin, which increased 14% while the re-export of foreign goods grew 7%. The growth in the exports of goods of Estonian origin compared to August 2015 was influenced the most by a rise in the exports of electrical equipment, miscellaneous manufactured articles, mineral products, base metals and articles of base metal. Among goods of Estonian origin, the biggest decrease occurred in the exports of agricultural products and food preparations. By country, the exports of goods of Estonian origin increased the most in terms of exports to Mexico, Finland and Germany.
The main countries of consignment in August were Finland (13% of Estonia’s total imports), Germany (11%) and Lithuania (10%). The biggest rise occurred in imports from Russia, Germany and China. Compared to August 2015, there was a growth in the imports of mineral products from Russia, of transport equipment from Germany and of electrical equipment from China. The greatest decrease occurred in imports from Poland.
In August, the main commodities imported to Estonia were electrical equipment, agricultural products and food preparations, mechanical appliances, transport equipment and mineral products. The growth in imports was influenced the most by increased imports of transport equipment, agricultural products and food preparations, textiles and textile articles. The biggest fall occurred in the imports of mineral products.
In August 2016, export prices were at the same level as in August 2015, but import prices were down by 3%.
In August compared to July, the exports of goods increased by 15% and imports by 5%.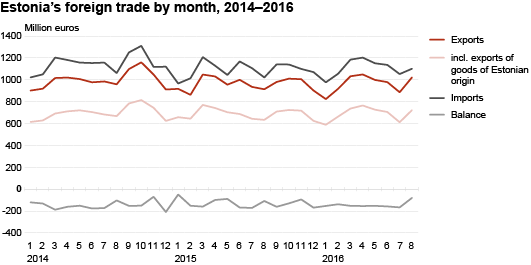
| Country of destination, group of countries | Exports, million euros | Share, % | Change compared to same month of previous year, % | Country of consignment,group of countries | Imports, million euros | Share, % | Change compared to same month of previous year, % |
|---|---|---|---|---|---|---|---|
| TOTAL | 1,021.7 | 100 | 12 | TOTAL | 1,101.4 | 100 | 8 |
| EU-28 | 726.4 | 71 | 5 | EU-28 | 905.0 | 82 | 5 |
| Euro area 19 | 463.7 | 45 | 8 | Euro area 19 | 644.6 | 59 | 5 |
| Non-EU | 295.3 | 29 | 33 | Non-EU | 196.4 | 18 | 22 |
| 1. Sweden | 171.7 | 17 | 0 | 1. Finland | 143.7 | 13 | 0 |
| 2. Finland | 167.9 | 16 | 13 | 2. Germany | 125.8 | 11 | 10 |
| 3. Latvia | 97.3 | 10 | -7 | 3. Lithuania | 110.6 | 10 | 2 |
| 4. Russia | 67.5 | 7 | -8 | 4. Sweden | 94.9 | 9 | 5 |
| 5. Lithuania | 61.3 | 6 | 13 | 5. Latvia | 94.9 | 9 | 7 |
| 6. Germany | 58.6 | 6 | 30 | 6. Poland | 76.3 | 7 | -3 |
| 7. Norway | 47.1 | 5 | 24 | 7. Netherlands | 63.5 | 6 | 13 |
| 8. Mexico | 34.9 | 3 | - | 8. Russia | 60.8 | 6 | 35 |
| 9. Denmark | 25.8 | 3 | 3 | 9. China | 49.8 | 5 | 20 |
| 10. USA | 23.4 | 2 | 3 | 10. United Kingdom | 26.8 | 2 | -6 |
| Commodity section (chapter) by Combined Nomenclature (CN) | Exports | Imports | Balance, million euros | ||||
|---|---|---|---|---|---|---|---|
| million euros | share, % | change compared to same period of previous year. % | million euros | share, % | change compared to same period of previous year. % | ||
| TOTAL | 1,021.7 | 100 | 12 | 1,101.4 | 100 | 8 | -79.7 |
| Agricultural products and food preparations (I–IV) | 81.4 | 8 | 2 | 126.3 | 11 | 9 | -44.9 |
| Mineral products (V) | 89.2 | 9 | 4 | 96.1 | 9 | -10 | -6.9 |
| Raw materials and products of chemical industry (VI) | 47.0 | 5 | 8 | 87.2 | 8 | 10 | -40.2 |
| Articles of plastics and rubber (VII) | 37.7 | 4 | 24 | 65.3 | 6 | 11 | -27.7 |
| Wood and articles of wood (IX) | 91.8 | 9 | 3 | 35.7 | 3 | 12 | 56.1 |
| Paper and articles thereof (X) | 30.5 | 3 | 11 | 24.4 | 2 | 17 | 6.1 |
| Textiles and textile articles (XI) | 34.8 | 3 | 26 | 61.7 | 6 | 20 | -26.9 |
| Base metals and articles of base metal (XV) | 72.6 | 7 | 12 | 95.7 | 9 | 10 | -23.1 |
| Mechanical appliances (84) | 69.1 | 7 | -4 | 101.6 | 9 | -3 | -32.5 |
| Electrical equipment (85) | 231.2 | 23 | 13 | 188.6 | 17 | 2 | 42.7 |
| Transport equipment (XVII) | 61.5 | 6 | 21 | 101.5 | 9 | 26 | -40.0 |
| Miscellaneous manufactured articles (XX) | 102.3 | 10 | 34 | 33.6 | 3 | 18 | 68.7 |
| Other | 72.6 | 6 | 17 | 83.7 | 8 | 17 | -11.0 |
The statistics are based on the questionnaires “Intrastat” and “Exports (sale of fish and crustaceans in foreign waters and ports)”, the due dates of which were, respectively, 14 and 15 September 2016, and on the customs declaration data of the Estonian Tax and Customs Board, which were sent to Statistics Estonia on 20 September 2016. Statistics Estonia published the monthly summary of foreign trade in 13 working days.
As of January 2016, Statistics Estonia publishes the exports of goods of Estonian origin on a monthly basis. The data are available in the Statistical Database. The time series start from 2013.