In March the decrease in exports of goods was influenced by electrical equipment and mineral products
In March, exports from Estonia amounted to 1 billion euros and imports to Estonia to 1.2 billion euros at current prices. The trade deficit was 172 million euros (in March 2015, it was 153 million euros).
The top destination country of Estonia’s exports in March was Sweden (20% of Estonia’s total exports), followed by Finland (16%) and Latvia (9%). There was a decrease in the exports to the Netherlands and Norway, with a decrease in the exports of petroleum products to the Netherlands and mechanical appliances to Norway. The biggest increase in exports occurred in the exports to Turkey and Lithuania. There was an increase in the number of articles of iron and steel, electrical equipment and live bovine animals exported to Turkey and transport equipment and electrical equipment exported to Lithuania.
The biggest share in Estonia’s exports in March was held by electrical equipment, followed by wood and products thereof and miscellaneous manufactured articles. In March the decrease in the exports of goods was significantly influenced by mineral products, electrical equipment, and agricultural products and food preparations. There was an increase in the exports of mechanical appliances and miscellaneous manufactured articles.
The share of goods of Estonian origin in exports was 70% in March. The exports of goods of Estonian origin decreased by 3% or 23 million euros compared to March of the previous year. The share of goods of Estonian origin was greatest in the commodity sections of wood and products thereof (97%) and miscellaneous manufactured articles (90%) and smallest in mineral products (24%). The exports of goods of Estonian origin were influenced the most by a decrease in the exports of mineral products and electrical equipment.
The main countries of consignment in March were Finland (15% of Estonia’s total imports), Germany (12%), Latvia, Sweden, Lithuania and Poland (each 8%). The biggest decrease occurred in imports from Russia and Lithuania, where there was a decrease in the imports of mineral products. At the same time, the greatest increase occurred in imports from Finland and Germany. The imports of electrical equipment from Finland and the imports of transport equipment from Germany increased.
In March, the main commodities imported were electrical equipment, mechanical appliances and transport equipment. The decrease in imports was significantly influenced by the decreased imports of mineral products. At the same time, the imports of mechanical appliances and transport equipment grew.
In the first quarter in this year export from Estonia amounted to 2.8 billion euros and imports to Estonia to 3.2 billion euros. The trade deficit in the first quarter was 453 million euros (in the first quarter of 2015, it was 346 million euros).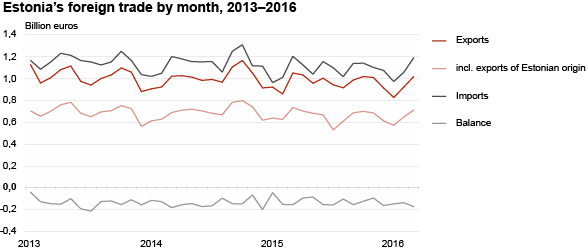
| Country of destination, group of countries | Exports, million euros | Share, % | Change compared to same month of previous year, % | Country of consignment, group of countries | Imports, million euros | Share, % | Change compared to same month of previous year, % |
|---|---|---|---|---|---|---|---|
| TOTAL | 1 020.9 | 100 | -3 | TOTAL | 1 193.2 | 100 | -1 |
| EU-28 | 763.8 | 75 | -3 | EU-28 | 999.3 | 84 | 4 |
| Euro area 19 | 467.3 | 46 | -4 | Euro area 19 | 710.0 | 60 | 4 |
| Non-EU | 257.1 | 25 | -2 | Non-EU | 193.9 | 16 | -19 |
| 1. Sweden | 202.3 | 20 | -3 | 1. Finland | 184.8 | 15 | 12 |
| 2. Finland | 160.0 | 16 | -2 | 2. Germany | 148.7 | 12 | 12 |
| 3. Latvia | 94.9 | 9 | -2 | 3. Latvia | 99.0 | 8 | 2 |
| 4. Russia | 67.8 | 7 | 9 | 4. Sweden | 98.4 | 8 | 3 |
| 5. Lithuania | 65.1 | 6 | 15 | 5. Lithuania | 93.6 | 8 | -12 |
| 6. Germany | 57.2 | 6 | 2 | 6. Poland | 92.5 | 8 | 7 |
| 7. Norway | 36.8 | 4 | -22 | 7. Netherlands | 67.5 | 6 | 6 |
| 8. Denmark | 34.4 | 3 | 15 | 8. Russia | 58.7 | 5 | -43 |
| 9. USA | 29.3 | 3 | -21 | 9. China | 53.6 | 4 | -2 |
| 10. Netherlands | 24.7 | 2 | -35 | 10. Italy | 33.0 | 3 | 4 |
| Commodity section (chapter) by Combined Nomenclature (CN) | Exports | Imports | Balance, million euros | ||||
|---|---|---|---|---|---|---|---|
| million euros | share, % | change compared to same period of previous year. % | million euros | share, % | change compared to same period of previous year. % | ||
| TOTAL | 1 020.9 | 100 | -3 | 1 193.2 | 100 | -1 | -172.3 |
| Agricultural products and food preparations (I–IV) | 86.5 | 8 | -3 | 111.9 | 9 | -4 | -25.5 |
| Mineral products (V) | 61.8 | 6 | -46 | 88.0 | 7 | -36 | -26.2 |
| Raw materials and products of chemical industry (VI) | 52.7 | 5 | 3 | 112.0 | 9 | -3 | -59.3 |
| Articles of plastics and rubber (VII) | 35.6 | 3 | 3 | 66.9 | 6 | 4 | -31.3 |
| Wood and products thereof (IX) | 109.1 | 11 | 2 | 37.8 | 3 | 0 | 71.3 |
| Paper and articles thereof (X) | 29.2 | 3 | -1 | 23.5 | 2 | -3 | 5.7 |
| Textiles and products thereof (XI) | 33.6 | 3 | 9 | 57.7 | 5 | -1 | -24.1 |
| Metals and products thereof (XV) | 70.0 | 7 | 4 | 91.4 | 8 | -2 | -21.4 |
| Mechanical appliances (84) | 88.2 | 9 | 21 | 152.5 | 13 | 22 | -64.3 |
| Electrical equipment (85) | 224.1 | 22 | -4 | 210.9 | 18 | 5 | 13.1 |
| Transport equipment (XVII) | 63.7 | 6 | -1 | 128.0 | 11 | 10 | -64.3 |
| Miscellaneous manufactured articles (XX) | 97.9 | 10 | 8 | 32.6 | 3 | -2 | 65.4 |
| Other | 68.6 | 7 | -1 | 79.9 | 6 | -4 | -11.4 |
The statistics are based on the questionnaires “Intrastat” and “Exports (sale of fish and crustaceans in foreign waters and ports)”, the due dates of which were, respectively, 14 and 15 April 2016, and on the customs declaration data of the Estonian Tax and Customs Board, which were sent to Statistics Estonia on 20 April 2016. Statistics Estonia published the monthly summary of foreign trade in 13 working days.
As of January 2016, Statistics Estonia publishes the exports of goods of Estonian origin on a monthly basis. The data are available in the Statistical Database. The time series begin in 2013.