In January exports of goods decreased by a tenth
In January, exports from Estonia amounted to 825 million euros and imports to Estonia to 983 million euros at current prices. The last time that exports were so small was five years ago in January 2011. The trade deficit was 158 million euros (in January 2015 it was 42 million euros).
The top destination country of Estonia’s exports in January was Sweden (20% of Estonia’s total exports), followed by Finland (16%) and Latvia (10%). There was a decrease in the exports to most of the top destination countries, the biggest decrease occurred in exports to Sweden and the USA (down by 29 million and 17 million euros, respectively).
The biggest share in Estonia’s exports in January was held by electrical equipment, followed by wood and products thereof, mechanical appliances and miscellaneous manufactured articles. The biggest decrease occurred in the exports of electrical equipment (incl. data communication equipment) and mineral products (incl. motor spirits).
The share of goods of Estonian origin in exports was 69% in January. Exports of goods of Estonian origin decreased by 12% compared to January of the previous year. Of the top ten destination countries for exports from Estonia, the share of goods of Estonian origin in exports was biggest in exports to Sweden (87%) and Finland (78%) but smallest to Russia (16%). Exports of goods of Estonian origin are the export of goods produced and processed in Estonia.
The main countries of consignment in January were Finland (14% of Estonia’s total imports), Lithuania (12%) and Germany (11%). The biggest increase occurred in imports from Lithuania and Latvia (up by 39 million and 14 million euros, respectively). At the same time, the greatest decrease occurred in imports from Russia (down by 23 million euros).
In January, the main commodities imported were electrical equipment, mineral products, agricultural products and food preparations and mechanical appliances. The increase was biggest for the the imports of transport equipment and mineral products. At the same time, the imports of electrical equipment decreased significantly.
In the comparison of December 2015 and January 2016, exports of goods decreased 10% and imports 9%.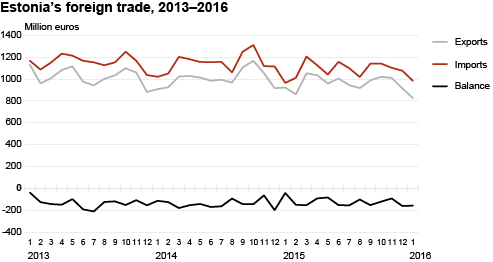
| Country of destination, group of countries | Exports, million euros | Share, % | Change compared to same month of previous year, % | Country of consignment, group of countries | Imports, million euros | Share, % | Change compared to same month of previous year, % |
|---|---|---|---|---|---|---|---|
| TOTAL | 825.2 | 100 | -11 | TOTAL | 982.8 | 100 | 2 |
| EU-28 | 650.9 | 79 | -8 | EU-28 | 829.6 | 84 | 7 |
| Euro Area 19 | 385.7 | 47 | -8 | Euro Area 19 | 594.6 | 61 | 8 |
| Non EU | 174.3 | 21 | -20 | Non EU | 153.2 | 16 | -19 |
| 1.Sweden | 164.2 | 20 | -15 | 1. Finland | 139.2 | 14 | 0 |
| 2.Finland | 131.8 | 16 | 0 | 2. Lithuania | 115.7 | 12 | 51 |
| 3.Latvia | 85.8 | 10 | -11 | 3. Germany | 105.4 | 11 | 11 |
| 4. Lithuania | 48.1 | 6 | -1 | 4. Latvia | 94.9 | 10 | 18 |
| 5. Germany | 46.9 | 6 | -3 | 5. Sweden | 93.2 | 9 | 13 |
| 6. Russia | 35.7 | 4 | -9 | 6. Poland | 69.3 | 7 | -7 |
| 7.Norway | 35.4 | 4 | -14 | 7. Netherlands | 60.5 | 6 | -15 |
| 8.Poland | 33.6 | 4 | 31 | 8. Russia | 43.6 | 4 | -34 |
| 9. Denmark | 33.4 | 4 | 2 | 9. China | 43.5 | 4 | 1 |
| 10.USA | 27.3 | 3 | -38 | 10. United Kingdom | 22.9 | 2 | 8 |
| Commodity section (chapter) by Combined Nomenclature (CN) | Exports | Imports | Balance, million euros | ||||
|---|---|---|---|---|---|---|---|
| million euros | share, % | change compared to same period of previous year, % | million euros | share, % | change compared to same period of previous year, % | ||
| TOTAL | 825.2 | 100 | -11 | 982.8 | 100 | 2 | -157.6 |
| Agricultural products and food preparations (I–IV) | 68.1 | 8 | -16 | 98.0 | 10 | 4 | -29.8 |
| Mineral products (V) | 63.1 | 8 | -36 | 132.7 | 14 | 14 | -69.6 |
| Raw materials and products of chemical industry (VI) | 36.4 | 4 | -6 | 83.4 | 8 | 4 | -47.0 |
| Articles of plastics and rubber (VII) | 25.3 | 3 | -2 | 49.2 | 5 | 4 | -23.9 |
| Wood and products thereof (IX) | 95.2 | 12 | 5 | 27.2 | 3 | -4 | 68.0 |
| Paper and articles thereof (X) | 24.5 | 3 | -5 | 19.8 | 2 | -2 | 4.7 |
| Textiles and products thereof (XI) | 26.5 | 3 | -4 | 47.6 | 5 | 7 | -21.1 |
| Metals and products thereof (XV) | 48.0 | 6 | -31 | 71.1 | 7 | -12 | -23.1 |
| Mechanical appliances (84) | 78.7 | 10 | 50 | 96.1 | 10 | 14 | -17.3 |
| Electrical equipment (85) | 172.9 | 21 | -25 | 179.3 | 18 | -14 | -6.4 |
| Transport equipment (XVII) | 48.7 | 6 | -1 | 92.9 | 9 | 25 | -44.2 |
| Miscellaneous manufactured articles (XX) | 79.1 | 10 | 0 | 24.4 | 2 | 5 | 54.6 |
| Other | 58.4 | 6 | 9 | 61.0 | 7 | -2 | -2.6 |
The statistics are based on the questionnaires “Intrastat” and “Exports (sale of fish and crustaceans in foreign waters and ports)”, the due dates of which were, respectively, 14 and 15 February 2016, and on the customs declaration data of the Estonian Tax and Customs Board, which were sent to Statistics Estonia on 20 February 2016. Statistics Estonia published the monthly summary of foreign trade in 11 working days.
As of January 2016, Statistics Estonia publishes the exports of goods of Estonian origin on a monthly basis. The data are available in the Statistical Database. The time series begin in 2013.