In July the growth of industrial production continued
Since January, manufacturing showed a stable 2–6% growth compared to the same month of the previous year. In July the production in manufacturing increased by 4% compared to July 2012. The production exceeded the volume of the previous year in more than half of the branches of industry. Among the branches of industry holding larger shares, the production grew in the manufacture of electronic, food, wood and chemical products. The volume of production fell in the manufacture of metal products, electrical equipment and furniture.
In July, 70% of the whole production of manufacturing was sold on the external market. According to unadjusted data, the export sales of manufacturing production grew 12% compared to July 2012. The demand on the domestic market was lower – domestic sales increased 5% compared to the previous year.
In July 2013 compared to June, the seasonally adjusted total industrial production increased by 2%, manufacturing production fell 1%.
Compared to July 2012, the production of electricity increased by 26%, while the production of heat fell 1%. The growth of electricity production was mainly caused by the partly replacement of imports of electricity with own production.
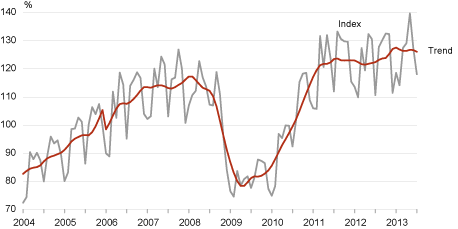
The volume index and trend of production in manufacturing, January 2004 – July 2013 (2010 = 100)
| Economic activity | Change compared to the previous month according to seasonally adjusted dataa | Change compared to the corresponding month of the previous year | |
|---|---|---|---|
| according to unadjusted data | according to working-day adjusted datab | ||
| TOTAL | 2.1 | 10.5 | 7.9 |
| Energy production | 3.4 | 22.7 | 21.0 |
| Mining | 15.9 | 37.7 | 35.4 |
| Manufacturing | -1.1 | 6.8 | 3.9 |
| manufacture of computer, electronic and optical products | -3.9 | 14.5 | 11.1 |
| manufacture of wood and wood products | -4.5 | 6.6 | 4.3 |
| manufacture of food products | 4.5 | 7.9 | 6.3 |
| manufacture of fabricated metal products | -9.9 | -6.1 | -9.2 |
| manufacture of electrical equipment | -6.4 | -5.1 | -8.3 |
| manufacture of chemicals and chemical products | -3.3 | 11.9 | 8.9 |
| manufacture of furniture | -3.0 | -1.3 | -4.8 |
| manufacture of motor vehicles | 8.4 | 17.1 | 14.1 |
| manufacture of building materials | 4.1 | 14.7 | 12.0 |
| manufacture of machinery and equipment | 1.3 | 7.7 | 4.0 |
a In case of the seasonally adjusted volume index of industrial production, the impact of the differing number of working days in a month and seasonally recurring factors have been eliminated. It is calculated only in comparison with the previous period.
b In case of the working-day adjusted volume index of industrial production, the impact of the differing number of working days in a month has been eliminated. It is calculated only in comparison with the corresponding period of the previous year.