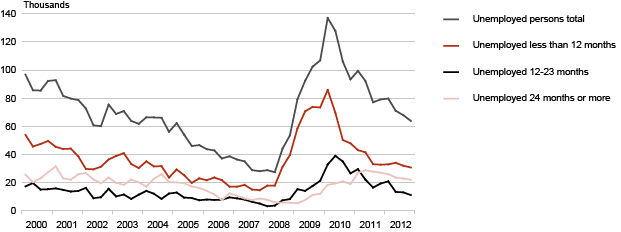
Unemployment decreased last year
According to the data of the Labour Force Survey, the estimated number of unemployed persons was 64,000 in the 4th quarter of 2012, decreasing by 4,000 persons compared to the 3rd quarter. The unemployment rate in the 4th quarter was smaller than in the previous quarter as well as in the same quarter of the previous year (when the unemployment rate was 9.7% and 11.4%, respectively).
In 2012, the annual average unemployment rate was the lowest of the last four years. It was 12.5% in 2011. The annual average number of unemployed persons decreased by 16,000 from 87,000 in 2011. There was also a slight decrease in the unemployment rate of young people (aged 15–24) – from 22.3% in 2011 down to 20.9% in 2012.
Long-term unemployment has decreased as well. The long-term unemployed (i.e. people who had been looking for a job for one year or more) numbered 38,000 in 2012, which is 11,000 less than in the previous year. The number of the very long-term unemployed (i.e. people who had been looking for a job for two years or more) started to decline in mid-2011, reaching 24,000 in 2012. The share of the long-term unemployed among the unemployed was 54%, which is smaller than in the 2011 (57%). At the same time, the share of the very long-term unemployed among the unemployed increased by one percentage point to 33% in 2012.
The employment rate of the population aged 15–74 was 61.0% in the 4th quarter of 2012, which is 0.9 percentage points lower than in the 3rd quarter, but 1.3 percentage points higher than in the 4th quarter of 2011. In the 4th quarter of 2012, the estimated number of employed persons was 625,000, which is 10,000 or 1.7% more compared to the same quarter of the previous year. In 2012, the annual average number of employed persons was 624,000, which is 15,000 or 2.5% more than in the previous year. The growth in employment was most of all influenced by an increase in the number of persons employed in transportation and storage, information and communication, education, and administrative and support service activities. In 2012, there was a slight decrease in the number of persons employed in construction and manufacturing, which used to be the main drivers of employment growth.
In 2012, employment increased mainly due to decreased unemployment. The share of economically inactive persons (students, retired persons, homemakers, discouraged persons, etc.) in the population aged 15–74 was 32%, i.e. 329,000 persons, which is 5,000 less than in 2011. Among inactive persons, the number of pension-aged persons and persons inactive due to studies decreased the most. Discouraged persons (i.e. persons who have stopped seeking a job) numbered 7,000 in 2012, which is 3,000 less than in the previous year.
In the calculation of the estimates for 2012, the estimated number of population published by Statistics Estonia as at 1 January 2012 has been used to assure comparability in time series; this population figure has not been adjusted with the data of the 2011 Population and Housing Census. Labour market time series adjusted with the number of population of the 2011 Population and Housing Census will be published in the 1st quarter of 2014.
Unemployment rate is the share of the unemployed in the labour force (the sum of employed and unemployed persons). Employment rate is the share of the employed in the working-age population (aged 15–74). The estimates are based on the data of the Labour Force Survey. Statistics Estonia has been conducting the Labour Force Survey since 1995 and every quarter 5,000 persons participate in the survey. The Labour Force Survey is carried out by statistical organisations in all the European Union Member States on the basis of a harmonised methodology.
Unemployed persons by duration of unemployment, 1st quarter 2000 – 4th quarter 2012
