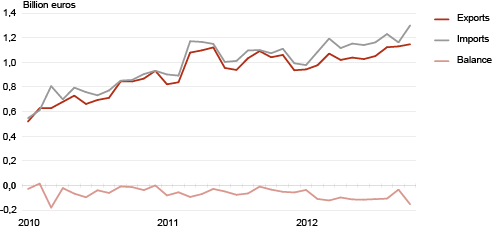
In October the foreign trade deficit increased significantly
In October 2012 compared to October of the previous year, exports of goods from Estonia increased by 10% and imports to Estonia by 21%. Due to the faster growth in imports than in exports, the trade deficit also increased significantly. The trade deficit was registered as 152 million euros which is nearly five times bigger than in October of the previous year. In monthly basis, Estonia’s trade deficit was last bigger in March 2010, when it was 179 million euros.
In October, in Estonia’s exports the biggest share was held by machinery and equipment (28% of Estonia’s total exports), followed by agricultural products and food preparations (16%) and mineral fuels (incl. motor spirits, shale oils and electricity – 10%). The increase in exports compared to October 2011 was mainly influenced by the increase in the dispatches of machinery and equipment (up by 28%). Dispatches of agricultural products and food preparations also increased significantly (up by 62%, mainly influenced by cereals, incl. barley and wheat). At the same time, exports of mineral fuels decreased (down by 26%).
In October the biggest share of Estonia’s imports was held by machinery and equipment (33% of Estonia’s total imports), followed by mineral fuels (11%) and agricultural products and food preparations (10%). There was a significant increase in the arrivals of machinery and equipment (up by 51%) compared to October of the previous year. At the same time the arrivals of mineral fuels decreased (down by 22%).
The biggest share of commodities was exported to Sweden (16% of Estonia’s total exports), followed by Finland (15%) and Russia (11%). Compared to October 2011, the increase in total exports was mostly influenced by the increase in the dispatches to Sweden and Germany (up by 37% and 50%, respectively). At the same time, exports to the Netherlands and USA decreased. Electrical equipment and wood were the main commodities exported to Sweden; electrical equipment and furniture to Finland and mechanical equipment and organic chemicals to Russia. Exports to Germany increased due to the increase in the dispatches of cereals.
The main countries of consignment were Finland (13% of Estonia’s total imports), Sweden (11%) and Germany (10%). The increase in the total imports was mostly influenced by the increase in the arrivals from Norway and Sweden (up by 9 times and 43%, respectively). At the same time, imports from Russia decreased by nearly a third. Fuels and electrical equipment were the main commodities imported from Finland, electrical equipment and transport equipment from Sweden and transport equipment and mechanical equipment from Germany. Imports from Norway increased mainly due to the increase in the arrivals of electric conductors.
Compared to September 2012, exports increased by 2% and imports by 12%. Exports increased due to the increase in the dispatches of agricultural products and food preparations (incl. cereals), and imports due to the increase in the arrivals of machinery and equipment.
The economic sentiment indicator, which reflects Estonia’s entrepreneurs’ and consumers’ confidence, deteriorated in October as well as in November. According to Eurostat data, in November the same indicator deteriorated also in Sweden, but improved in Finland and Germany.
Estonia’s trade, 2010–2012
| Country of destination, group of countries | Exports, million euros | Share, % | Change compared to same month of previous year, % | Country of consignment, group of countries | Imports, million euros | Share, % | Change compared to same month of previous year, % |
|---|---|---|---|---|---|---|---|
| Total | 1 147.6 | 100 | 10 | Total | 1 299.7 | 100 | 21 |
| EU27 | 800.3 | 70 | 19 | EU27 | 1 030.6 | 79 | 20 |
| EA | 357.4 | 31 | 12 | EA | 467.0 | 36 | 21 |
| CIS | 151.1 | 13 | -9 | CIS | 86.2 | 7 | -26 |
| 1. Sweden | 178.6 | 16 | 37 | 1. Finland | 172.1 | 13 | 16 |
| 2. Finland | 171.5 | 15 | 10 | 2. Sweden | 140.2 | 11 | 43 |
| 3. Russia | 126.1 | 11 | -10 | 3. Germany | 125.6 | 10 | 25 |
| 4. Latvia | 116.4 | 10 | 21 | 4. Lithuania | 115.7 | 9 | 21 |
| 5. Germany | 80.7 | 7 | 50 | 5. Latvia | 114.0 | 9 | 1 |
| 6. Lithuania | 69.2 | 6 | 49 | 6. Poland | 80.1 | 6 | 21 |
| 7. Norway | 37.5 | 3 | -1 | 7. Norway | 63.0 | 5 | 813 |
| 8. USA | 37.0 | 3 | -33 | 8. Russia | 62.4 | 5 | -32 |
| 9. Denmark | 23.2 | 2 | -19 | 9. Netherlands | 51.9 | 4 | 34 |
| 10. Netherlands | 22.8 | 2 | -52 | 10. China | 50.5 | 4 | 101 |
| Commodity section by Combined Nomenclature (CN) | Exports | Imports | Balance, million euros | ||||
|---|---|---|---|---|---|---|---|
| million euros | share, % | change compared to same month of previous year, % | million euros | share, % | change compared to same month of previous year, % | ||
| TOTAL | 1 147.6 | 100 | 10 | 1 299.7 | 100 | 21 | -152.2 |
| Agricultural products and food preparations (I–IV) | 181.9 | 16 | 62 | 127.3 | 10 | 12 | 54.6 |
| Mineral products (V) | 111.8 | 10 | -26 | 142.8 | 11 | -22 | -31.0 |
| Raw materials and products of chemical industry (VI) | 50.7 | 4 | -22 | 106.4 | 8 | 30 | -55.7 |
| Articles of plastics and rubber (VII) | 39.5 | 3 | 22 | 67.3 | 5 | 24 | -27.8 |
| Wood and products thereof (IX) | 86.0 | 8 | 3 | 28.9 | 2 | 28 | 57.1 |
| Paper and articles thereof (X) | 28.1 | 2 | -1 | 24.5 | 2 | 21 | 3.6 |
| Textiles and products thereof (XI) | 34.0 | 3 | 25 | 64.3 | 5 | 40 | -30.3 |
| Metals and products thereof (XV) | 85.6 | 8 | -11 | 93.9 | 7 | 1 | -8.3 |
| Machinery and equipment (XVI) | 324.4 | 28 | 28 | 425.2 | 33 | 51 | -100.8 |
| Transport equipment (XVII) | 57.5 | 5 | 18 | 124.3 | 10 | 39 | -66.8 |
| Miscellaneous manufactured articles (XX) | 80.0 | 7 | 13 | 29.2 | 2 | 20 | 50.8 |
| Other | 68.1 | 6 | -7 | 65.6 | 5 | 2 | 2.5 |