In April trade decreased
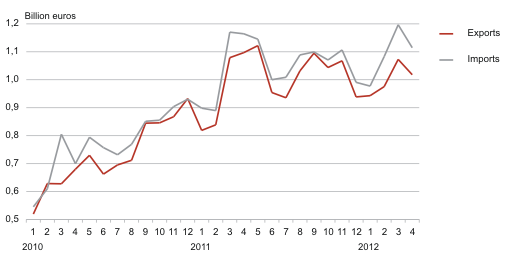
In April 2012, exports from Estonia amounted to 1 billion euros and imports to Estonia to 1.1 billion euros at current prices. The trade deficit was 97 million euros and it slightly increased compared to April 2011.
In monthly basis or compared to the previous month, exports and imports increased during the first months of the year, but in April compared to March exports decreased by 5% and imports by 7%. The decrease in exports turnover was mainly influenced by the decrease in the dispatches of machinery and equipment, and imports turnover by the decrease in the arrivals of mineral fuels.
In Estonia’s exports in April, the biggest share was held by machinery and equipment (28% of Estonia’s total exports), followed by mineral fuels (incl. motor spirits, shale oils and electricity) (17%) and metals and products thereof (10%). The decrease in exports compared to April 2011 was mainly influenced by the decrease in the dispatches of fuels and machinery and equipment (down by 33% and 5%, respectively). The slight increase was mentioned in the dispatches of the raw materials and products of chemical industry (the growth rate 20%).
In April the biggest share of Estonia’s imports was held by machinery and equipment (26% of Estonia’s total imports), followed by mineral fuels (15%) and transport equipment (12%). The decrease in total imports compared to the previous year, was mostly influenced by a decrease in the arrivals of mineral fuels (down by 47%). Only the arrivals of transport equipment increased significantly (by 52%).
The top destination countries of Estonia’s exports were Finland (15% of Estonia’s total exports), followed by Sweden (14%) and Russia (11%). Compared to April 2011, the decrease in total exports was mostly influenced by the decrease in the dispatches to Sweden and the USA (down by 29% and 47%, respectively). Exports to Russia increased by 21%. Electrical equipment, wood and products of wood and furniture were the main commodities exported to Finland and Sweden, mechanical and electrical equipment and dying products to Russia.
The main countries of consignment were Finland (14% of Estonia’s total imports), Sweden and Lithuania (10% both). Compared to April 2011, arrivals of goods from Russia and Latvia decreased significantly (down by 57% and 31%, respectively). But arrivals of goods from Lithuania and Ukraine increased. Fuels were the main commodities imported from Finland and Lithuania, electrical equipment and transport equipment from Sweden.
According to Estonian Institute of Economic Research, the economic sentiment indicator, which reflects Estonia’s entrepreneurs’ and consumers’ confidence, has also shown a positive trend in the first months of the year. But in April the indicator deteriorated. The same indicator decreased in May besides Estonia also in Sweden and Finland.
Estonian trade by months, 2010–2012
| Country of destination, group of countries | Exports, million euros | Share, % | Change compared to same month of previous year, % | Country of consignment, group of countries | Imports, million euros | Share, % | Change compared to same month of previous year, % |
|---|---|---|---|---|---|---|---|
| Total | 1 017.9 | 100 | -7 | Total | 1 114.6 | 100 | -4 |
| EU27 | 658.6 | 65 | -14 | EU27 | 872.5 | 78 | 4 |
| EA17 | 310.2 | 30 | -11 | EA17 | 396.9 | 36 | 13 |
| CIS | 136.6 | 13 | 20 | CIS | 139.5 | 13 | -35 |
| 1. Finland | 156.1 | 15 | 2 | 1. Finland | 154.8 | 14 | 24 |
| 2. Sweden | 137.9 | 14 | -29 | 2. Sweden | 115.8 | 10 | -10 |
| 3. Russia | 110.3 | 11 | 21 | 3. Lithuania | 114.9 | 10 | 48 |
| 4. Latvia | 82.8 | 8 | 16 | 4. Germany | 114.0 | 10 | 4 |
| 5. Nigeria | 61.1 | 6 | 23 | 5. Latvia | 94.2 | 8 | -31 |
| 6. Lithuania | 49.3 | 5 | 15 | 6. Russia | 80.4 | 7 | -57 |
| 7. Germany | 43.0 | 4 | -5 | 7. Poland | 65.1 | 6 | -17 |
| 8. USA | 37.5 | 4 | -47 | 8. United Kingdom | 39.3 | 4 | 31 |
| 9. Netherlands | 35.1 | 3 | 93 | 9. Ukraine | 38.8 | 3 | - |
| 10. Norway | 29.4 | 3 | 13 | 10. China | 34.2 | 3 | -17 |
| Commodity section by Combined Nomenclature (CN) | Exports | Imports | Balance, million euros | ||||
|---|---|---|---|---|---|---|---|
| million euros | share, % | change compared to same month of previous year, % | million euros | share, % | change compared to same month of previous year, % | ||
| TOTAL | 1 017.9 | 100 | -7 | 1 114.6 | 100 | -4 | -96.7 |
| Agricultural products and food preparations (I–IV) | 77.5 | 8 | 15 | 104.1 | 9 | 9 | -26.6 |
| Mineral products (V) | 174.3 | 17 | -33 | 166.9 | 15 | -47 | 7.4 |
| Raw materials and products of chemical industry (VI) | 47.9 | 5 | 20 | 88.7 | 8 | 14 | -40.8 |
| Articles of plastics and rubber (VII) | 31.4 | 3 | 10 | 55.7 | 5 | 16 | -24.3 |
| Wood and products thereof (IX) | 82.8 | 8 | 2 | 29.0 | 3 | 8 | 53.8 |
| Paper and articles thereof (X) | 24.7 | 2 | -9 | 19.3 | 2 | 6 | 5.4 |
| Textiles and products thereof (XI) | 27.8 | 3 | -4 | 43.5 | 4 | 4 | -15.7 |
| Metals and products thereof (XV) | 96.9 | 10 | 1 | 96.2 | 9 | 7 | 0.7 |
| Machinery and equipment (XVI) | 281.9 | 28 | -5 | 291.2 | 26 | -2 | -9.3 |
| Transport equipment (XVII) | 50.6 | 5 | -4 | 136.9 | 12 | 52 | -86.3 |
| Miscellaneous manufactured articles (XX) | 67.6 | 7 | 0 | 22.0 | 2 | 24 | 45.6 |
| Other | 54.5 | 4 | 4 | 61.1 | 5 | 24 | -6.6 |