In November the exports of goods increased by nearly a quarter
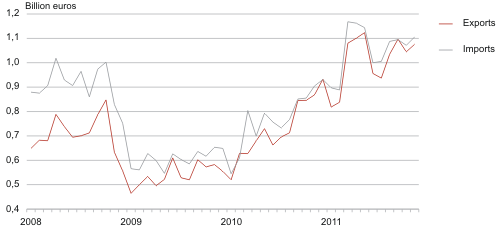
In November 2011, exports of goods from Estonia amounted to 1.08 billion euros and imports to Estonia to 1.11 billion euros. In November the trade increased compared to the same month of the previous year as well as to the previous month. In November 2011, exports as well as imports increased 3% compared to October 2011.
The faster growth of exports compared to imports reduced also the trade deficit. While the trade deficit in November 2010 was 37 million euros, then in November 2011 it was 30 million euros.
The first place among the destination countries of exports was held by Finland (16% of Estonia’s total exports), followed by Russia (14%) and Sweden (11%). For the third month in succession (since September 2011), Estonia’s total exports was mostly influenced by the increase in dispatches to Russia. In November exports to Russia increased by 64 million euros (or 1.6 times) compared to the same month of 2010. Exports to Sweden decreased by 46 million euros or by 27%. Electrical equipment, furniture and articles of iron or steel were mainly exported to Finland, mechanical and electrical equipment and beverages and alcohol to Russia, electrical equipment and wood and articles of wood to Sweden.
The largest amounts of goods were imported from Finland (14% of Estonia’s total imports), followed by Latvia (12%) and Germany (10%). Compared to November 2010, arrivals from Latvia and the United Kingdom influenced Estonia’s total imports the most. Imports from Latvia increased by 40% and from the United Kingdom by more than two times. Electrical equipment was mostly imported from Finland, fuels from Latvia and vehicles from Germany.
The trade surplus was mentioned in Estonia’s trade with the three biggest export destination countries (Finland, Russia and Sweden) or exports to those countries exceeded imports. The biggest trade surplus was registered in trade with Russia (77 million euros).
In November, the biggest shares in exports were held by machinery and equipment (24% of Estonia’s total exports), mineral products, incl. motor spirits, fuel oils and electricity (17%), and metals and products thereof (10%). The growth of Estonia’s total exports was mostly influenced by the dispatches of mineral products, which grew by 63% compared to November 2010. The growth in exports was also significantly influenced by the increase in the dispatches of metals and products thereof (the growth rate 44%).
In November the biggest shares of imports were also held by machinery and equipment (25% of Estonia’s total imports), mineral products (16%), and agricultural products and food preparations (10%). Similarly to exports, the growth of total imports was also mostly influenced by the arrivals of mineral products, which increased by 37% compared to November 2010. The arrivals of raw materials and products of chemical industry also increased significantly (53%).
According to the data of Eurostat, the economic sentiment indicator which reflects enterprisers’ and consumers’ confidence improved slightly in Estonia in November compared to October. The same indicator in December also improved in Estonia, but worsened in Sweden and Finland.
Estonia’s trade by months, 2008–2011
| Month | Exports, million euros | Imports, million euros | Balance, million euros | |||||
|---|---|---|---|---|---|---|---|---|
| 2010 | 2011 | change, % | 2010 | 2011 | change, % | 2010 | 2011 | |
| January | 520.0 | 818.4 | 57 | 544.9 | 897.1 | 65 | -24.9 | -78.7 |
| February | 628.4 | 838.2 | 33 | 609.8 | 888.6 | 46 | 18.5 | -50.4 |
| March | 627.6 | 1 080.2 | 72 | 804.0 | 1 168.0 | 45 | -176.4 | -87.8 |
| April | 679.8 | 1 100.7 | 62 | 699.2 | 1 162.3 | 66 | -19.5 | -61.6 |
| May | 729.8 | 1 123.4 | 54 | 793.9 | 1 144.1 | 44 | -64.1 | -20.7 |
| June | 662.6 | 955.9 | 44 | 756.7 | 999.9 | 32 | -94.2 | -44.0 |
| July | 695.4 | 937.0 | 35 | 732.9 | 1 005.4 | 37 | -37.5 | -68.4 |
| August | 712.7 | 1 034.5 | 45 | 767.1 | 1 087.5 | 42 | -54.3 | -53.0 |
| September | 844.8 | 1 096.5 | 30 | 851.2 | 1 094.7 | 29 | -6.3 | 1.8 |
| October | 845.8 | 1 044.7 | 24 | 855.0 | 1 071.4 | 25 | -9.2 | -26.7 |
| November | 868.2 | 1 076.0 | 24 | 904.7 | 1 105.9 | 22 | -36.5 | -29.8 |
| Country of destination, group of countries | Exports, million euros | Share, % | Change compared to same month of previous year, % | Country of consignment, group of countries | Imports, million euros | Share, % | Change compared to same month of previous year, % |
|---|---|---|---|---|---|---|---|
| Total | 1 076.0 | 100 | 24 | Total | 1 105.9 | 100 | 22 |
| EU27 | 685.7 | 64 | 14 | EU27 | 907.4 | 82 | 26 |
| EA17 | 318.2 | 30 | 26 | EA17 | 428.9 | 39 | 26 |
| CIS | 173.9 | 16 | 53 | CIS | 100.2 | 9 | 3 |
| 1. Finland | 166.8 | 16 | 14 | 1. Finland | 159.6 | 14 | 22 |
| 2. Russia | 150.3 | 14 | 73 | 2. Latvia | 130.9 | 12 | 40 |
| 3. Sweden | 122.0 | 11 | -27 | 3. Germany | 114.1 | 10 | 14 |
| 4. Latvia | 97.9 | 9 | 33 | 4. Sweden | 107.6 | 10 | 7 |
| 5. USA | 64.3 | 6 | 112 | 5. Lithuania | 79.4 | 7 | 16 |
| 6. Lithuania | 55.2 | 5 | 35 | 6. Russia | 73.8 | 7 | -9 |
| 7. Germany | 49.2 | 5 | 12 | 7. Poland | 65.8 | 6 | 7 |
| 8. Netherlands | 41.2 | 4 | 159 | 8. Netherlands | 57.9 | 5 | 83 |
| 9. China | 36.3 | 3 | 145 | 9. United Kingdom | 51.3 | 5 | 134 |
| 10. Norway | 34.7 | 3 | 0 | 10. Belgium | 27.5 | 2 | 86 |
| Commodity section by Combined Nomenclature (CN) | Exports | Imports | Balance, million euros | ||||
|---|---|---|---|---|---|---|---|
| million euros | share, % | change compared to same month of previous year, % | million euros | share, % | change compared to same month of previous year, % | ||
| TOTAL | 1 076.0 | 100 | 24 | 1 105.9 | 100 | 22 | -29.9 |
| Agricultural products and food preparations (I–IV) | 106.4 | 10 | 27 | 114.0 | 10 | 20 | -7.6 |
| Mineral products (V) | 181.4 | 17 | 63 | 181.9 | 16 | 37 | -0.5 |
| Raw materials and products of chemical industry (VI) | 54.8 | 5 | 41 | 107.6 | 10 | 53 | -52.8 |
| Articles of plastics and rubber (VII) | 32.3 | 3 | 13 | 54.3 | 5 | 3 | -22.0 |
| Wood and products thereof (IX) | 80.6 | 7 | 5 | 23.4 | 2 | -7 | 57.2 |
| Paper and articles thereof (X) | 26.7 | 3 | 0 | 21.6 | 2 | -7 | 5.1 |
| Textiles and products thereof (XI) | 29.9 | 3 | 32 | 46.2 | 4 | 13 | -16.3 |
| Metals and products thereof (XV) | 108.5 | 10 | 44 | 98.7 | 9 | 19 | 9.8 |
| Machinery and equipment (XVI) | 262.8 | 24 | 10 | 276.5 | 25 | 11 | -13.7 |
| Transport equipment (XVII) | 53.5 | 5 | 7 | 96.4 | 9 | 63 | -42.9 |
| Miscellaneous manufactured articles (XX) | 73.8 | 7 | 10 | 25.8 | 2 | 15 | 48.0 |
| Other | 65.3 | 6 | 40 | 59.5 | 6 | 19 | 5.8 |