In June the slowdown in the growth of industrial production continued
In June 2011, the production of manufacturing increased by over a quarter compared to June 2010. Export sales influenced the growth in production the most – 70% of the whole production of manufacturing was sold on the external market. The manufacturing production sold on the external market grew 40%, the domestic sales increased 16% compared to June of the previous year.
In June, the production exceeded the volume of the same month of the previous year in most branches of industry. Manufacturing of electronic products, which increased by three times compared to June of the previous year, influenced the growth in production the most. The branches holding bigger shares were also the manufacturing of wood, food and metal products where the production grew 13%, 4% and 8%, respectively. With respect to the branches of manufacturing holding smaller shares, the production increased considerably in the manufacturing of machinery and equipment mainly due to the increase in exports.
In June 2011 compared to May, the seasonally adjusted industrial production increased 2%, in manufacturing the production remained on the level of the previous month.
In June 2011 compared to June 2010, the production of electricity increased 7% and the production of heat decreased 5%.
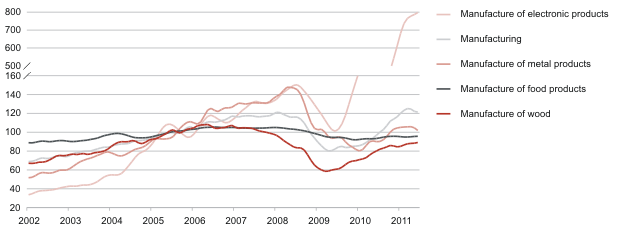
Trends of production in branches of industry, January 2002 – June 2011 (2005 = 100)
| Economic activity | change compared to the previous month according to seasonally adjusted dataa | change compared to the corresponding month of the previous year | |
|---|---|---|---|
| according to unadjusted data | according to working-day adjusted datab | ||
| TOTAL | 1.5 | 23.8 | 23.8 |
| Energy production | 2.7 | 4.8 | 4.8 |
| Mining | 20.7 | 26.7 | 26.7 |
| Manufacturing | 0.3 | 26.0 | 26.0 |
| manufacture of computer, electronic and optical products | 10.7 | 199.0 | 199.0 |
| manufacture of wood and wood products | 2.2 | 13.3 | 13.3 |
| manufacture of food products | -0.3 | 3.7 | 3.6 |
| manufacture of fabricated metal products | -16.0 | 8.4 | 8.4 |
| manufacture of electrical equipment | -1.9 | 18.6 | 18.6 |
| manufacture of chemicals and chemical products | -14.4 | -3.5 | -3.5 |
| manufacture of motor vehicles | 4.3 | 7.8 | 7.8 |
| manufacture of machinery and equipment | 17.8 | 89.9 | 89.9 |
| manufacture of rubber and plastic products | -4.8 | 3.3 | 3.3 |
| manufacture of building materials | -0.1 | 9.5 | 9.1 |
a In case of the seasonally adjusted volume index, the impact of the differing numbers of working days in a month and seasonally recurring factors has been eliminated. It is calculated only in comparison with the previous period.
b In case of the working-day adjusted volume index, the impact of the differing number of working days in a month has been eliminated. It is calculated only in comparison with the corresponding period of the previous year.