2010 was successful for Estonian industry
2010 was the year of recovery from economic crisis in Estonia as well as in the European Union as a whole. In April 2009 the industrial production in the EU decreased to the lowest level of the crisis, declining by a fifth compared to the same month of the previous year. At the same time, the decline of production in Estonia exceeded 30%, and remained in such a decline till July 2009. The downfall trend was relatively abruptly replaced with a growth at the beginning of 2010. When Estonia was the country with the largest decrease in manufacturing production among the EU Member States in the middle of 2009, then in the 2nd quarter of 2010 Estonia became the country with the most rapid growth in production.
When in 2009 as a whole compared to the previous year, the production decreased in all branches of manufacturing, then in 2010, the production exceeded the volume of the previous year in most branches. The growth in the production of manufacturing was most influenced by the branches holding bigger shares – manufacturing of electronic products where the production increased by nearly two times, and manufacturing of wood where the production grew more than a quarter. With respect to the branches of manufacturing holding smaller shares, the production increased considerably in the manufacturing of motor vehicles, machinery and equipment, metals, paper, pharmaceutical and plastic products, mainly due to the increase in exports. More than two thirds of the whole production of manufacturing was sold on the external market. Export sales of the manufacturing production grew 41% compared to 2009. The demand on the domestic market was significantly lower – in 2010 the domestic sales did not change compared to the previous year. The rapid growth in production was partly also influenced by the low reference base in 2009.
In December 2010, the production of industry increased 39% compared to December of the previous year; the production of manufacturing grew 41%.
In December 2010 compared to November, the seasonally adjusted industrial production rose 1%; the production of manufacturing grew 2% during the month.
In December compared to December 2009, the production of electricity increased 70% and the production of heat 8%. The increase in energy production was mainly caused by a growing demand for energy induced by more active manufacturing as well as by the growth in the exports of electricity.
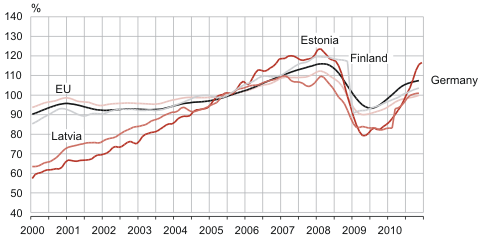
Volume index trends of production in manufacturing in the European Union,
January 2000 – December 2010 (2005 = 100)
| Economic activity | 2010 compared to 2009 | December 2010 | ||
|---|---|---|---|---|
| change compared to the previous month according to seasonally adjusted dataa | change compared to the corresponding month of the previous year | |||
| according to unadjusted data | according to working-day adjusted datab | |||
| TOTAL | 22.7 | 1.3 | 42.2 | 38.5 |
| Energy production | 31.0 | 11.7 | 38.4 | 38.4 |
| Mining | 7.0 | -5.3 | 6.6 | 5.1 |
| Manufacturing | 23.1 | 1.9 | 44.6 | 40.6 |
| manufacture of food products | 0.6 | 3.1 | 10.5 | 8.5 |
| manufacture of wood and wood products | 26.9 | -6.2 | 22.9 | 19.9 |
| manufacture of fabricated metal products | -2.8 | -5.7 | 25.9 | 21.4 |
| manufacture of computer, electronic and optical products | 176.8 | 20.9 | 263.8 | 252.3 |
| manufacture of electrical equipment | 11.6 | 4.5 | 54.1 | 48.6 |
| manufacture of chemicals and chemical products | 14.7 | -15.9 | 41.6 | 37.6 |
| manufacture of motor vehicles | 108.3 | -3.2 | 66.1 | 61.1 |
| manufacture of machinery and equipment | 27.8 | -6.7 | 46.6 | 41.2 |
| manufacture of rubber and plastic products | 24.5 | -3.7 | 35.9 | 30.7 |
| manufacture of building materials | 10.5 | -11.0 | 3.0 | -1.4 |
a In case of the seasonally adjusted volume index, the impact of the differing numbers of working days in a month and seasonally recurring factors has been eliminated. It is calculated only in comparison with the previous period.
b In case of the working-day adjusted volume index, the impact of the differing number of working days in a month has been eliminated. It is calculated only in comparison with the corresponding period of the previous year.