In January the industrial production reached the level of January of the previous year
In January 2010 compared to January 2009, the production of electricity increased 19%, the production of heat — 31%. The increase in energy production was caused mostly by a lower outdoor temperature and a rising demand of energy induced from it. The exports of electricity rose slightly too.
In January 2010 the production in manufacturing decreased 3% compared to January of the previous year. When in total of 2009 compared to the previous year, the production decreased in all branches of manufacturing, then in January the differences between branches of industry were large. The production of wearing apparel, chemical and metal products, machinery and equipment fell more than 20%. The production of food, beverages, building materials and electrical equipment decreased too. The main reason causing the decline was a continually insufficient demand. However, the manufacturing of metals and motor vehicles rose more than twice. Due to the small share in total manufacturing these branches did not affect the production essentially. The branches holding a big share, as manufacturing of electronic products, rose 30%, the manufacturing of wood — 15%, mainly due to the increase of exports. The production increased also in the manufacturing of leather, refined petroleum, pharmaceutical and plastic products.
In January 2010 compared to December 2009, the seasonally adjusted industrial production increased 4.5%.
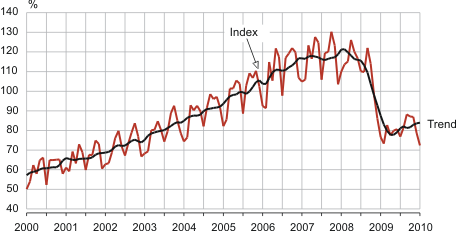
The volume index and trend of production in manufacturing, January 2000 – January 2010 (2005 = 100)
| Economic activity | January 2010 | ||
|---|---|---|---|
| change compared to the previous month according to seasonally adjusted dataa | change compared to the corresponding month of the previous year | ||
| according to unadjusted data | according to working-day adjusted datab | ||
| TOTAL | 4.5 | -2.4 | 0.3 |
| Energy production | 32.6 | 24.3 | 24.3 |
| Mining | 5.0 | -1.0 | 0.6 |
| Manufacturing | 2.3 | -5.6 | -2.8 |
| manufacture of food products | -0.1 | -10.3 | -8.4 |
| manufacture of beverages | 1.8 | -6.8 | -4.0 |
| manufacture of wood and wood products | 7.5 | 11.4 | 14.5 |
| manufacture of fabricated metal products | -1.6 | -23.2 | -20.3 |
| manufacture of computer, electronic and optical products | -17.8 | 28.9 | 30.3 |
| manufacture of electrical equipment | 16.8 | -13.6 | -10.7 |
| manufacture of chemicals and chemical products | 6.3 | -32.7 | -30.6 |
| manufacture of furniture | 2.8 | -4.7 | -1.5 |
| manufacture of rubber and plastic products | 22.2 | 12.0 | 16.7 |
| manufacture of building materials | 7.2 | -14.7 | -12.9 |
a In case of the seasonally adjusted volume index, the impact of the differing numbers of working days in a month and seasonally recurring factors has been eliminated. It is calculated only in comparison with the previous period.
b In case of the working-day adjusted volume index, the impact of the differing number of working days in a month has been eliminated. It is calculated only in comparison with the corresponding period of the previous year.