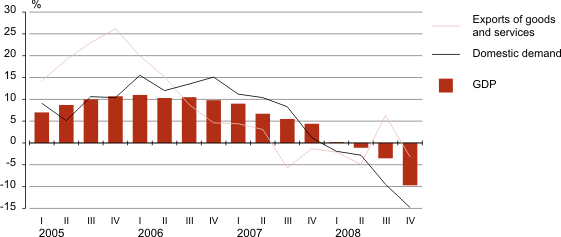
Gross domestic product decreased in 2008
Year 2008
In 2008 GDP at current prices was 248.1 billion kroons. The decrease in GDP accelerated gradually in the course of the year, influenced by the fast decrease in domestic demand. In addition, exports of goods and services decreased due to decline of external demand.
The domestic demand decreased by 7.4% compared to 2007. The decrease in domestic demand was influenced by households’ final consumption expenditures (HFCE) and gross fixed capital formation (GFCF), which started to decrease since the 2nd quarter. HFCE decreased by 4% influenced mainly by the decrease in expenditures on clothes and footwear, alcoholic beverages and tobacco, transport, restaurants and hotels. GFCF decreased by 8.6% influenced mainly by the decrease in investments in dwellings, machinery and equipment and transport equipment.
Along with the decrease in domestic demand imports of goods and services, especially in imports of goods has decreased as well (by 7.9% and 9.4%, respectively). Exports of goods and services decreased by 1.1%, whereas exports of goods by 0.3%. The decease in exports of goods was influenced mainly by the decrease in exports of wood and products of wood (except furniture) and refined petroleum products and fuel. At the same time, exports were supported by the fast growth of exports of electrical machinery and apparatus and metals. Due to the faster decrease in imports compared to exports the deficit of net exports in GDP has decreased (in 2008 it was -4.4%, in 2007 -10.9%).
The decrease in domestic demand and exports was caused by the decrease in value added of non-financial corporations sector by 4.6%. In 2007 the value added in the sector grew by 6.2%.
The value added decreased in the majority of economic activities in 2008. The decrease in value added of four bigger economic activities (together 47% of gross value added of economic activities), manufacturing, construction, wholesale and retail trade and transport, storage and communications had strong impact on the decrease in gross value added. The share of economic activities with the growth of value added was approximately 21% of the gross value added. The biggest impact had the growth of value added in public administration and defence.
4th quarter 2008
In the 4th quarter 2008, GDP decreased by 9.7% compared to the same period of the previous year. Compared to the 3rd quarter, the seasonally and working-day adjusted GDP decreased by 4.3%. In the 4th quarter the GDP decreased at current prices for the first time since 1995 (by 4.7%).
In the 4th quarter, GDP was substantially influenced by the decrease in domestic demand by 14.8%. The decrease in the components of the domestic demand, households’ final consumption expenditures (HFCE) and gross fixed capital formation (GFCF) speeded up. HFCE decreased in the majority of expenditure groups, except expenditures on health care. GFCF decreased the most in government sector, mainly due to the decrease in investments in buildings and structures. In corporations and households’ sectors GFCF decreased in all investment product groups.
Along with the decrease in domestic demand imports of goods and services, especially in imports of goods decreased as well (by 11.9% and 14.6%, respectively) in the 4th quarter 2008. The decrease in imports of machinery and equipment and motor vehicles had the biggest impact on the decrease in imports of goods. In addition to the decrease in domestic demand, GDP was influenced by the decrease in exports of goods and services, especially by exports of services (by 3.2% and 8.5%, respectively). Exports of goods decreased by 1%. The decrease in exports of food products and beverages and wood and products of wood (except furniture) had the biggest impact on the exports of goods. At the same time, exports of refined petroleum products and fuel increased considerably. The deficit of net exports in GDP was -3.9%. This has improved steadily since the 1st quarter of 2007.
Real growth of GDP, domestic demand and exports, 1st quarter 2005 – 4th quarter 2008

Value added decreased in the majority of economic activities in the 4th quarter 2008. Decrease in value added of four bigger economic activities (together 49% of gross value added of economic activities), manufacturing, construction, wholesale and retail trade and transport, storage and communications had strong impact on the decrease in gross value added. Value added grew in agriculture, forestry, public administration and defence and education. The share of these economic activities in gross value added was 16%.
In connection with the impeded production and consumption activity, receipts of the value added tax and excise taxes decreased steeply.
For meeting the consumers’ need to use short-term statistics sooner for estimating the economic situation and due to the improved submission of data, Statistics Estonia will publish flash estimate of economic growth on the 43rd day instead of the 44th after the end of the reference quarter since the 1st quarter of 2009. The new release dates have been presented in the release calendar /uudised/release-calendar