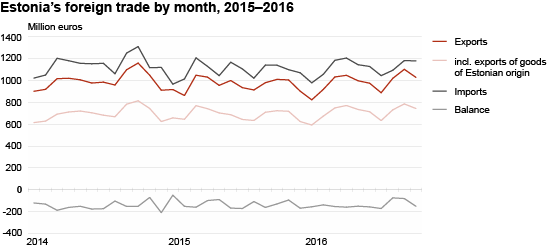
In October, export growth was supported by the exports of goods of Estonian origin
In October, exports from Estonia amounted to 1.0 billion euros and imports to Estonia to 1.2 billion euros at current prices. The trade deficit was 151 million euros (in October 2015, it was 129 million euros).
The top destination country of Estonia’s exports in October was Sweden (16% of Estonia’s total exports), followed by Finland (16%) and Latvia (9%). The biggest increase occurred in exports to Mexico and Germany (up by 15 million euros to both), mainly due to increased exports of electrical equipment. Exports to Sweden and Latvia decreased the most.
The biggest share in exports was held by electrical equipment, followed by wood and articles of wood, agricultural products and food preparations. The increase in exports was influenced by the exports of optical, measuring, checking and medical instruments (incl. medical apparatus, measuring instruments, thermostats), electrical equipment (incl. communication equipment) and mineral products (incl. motor spirit, shale oil). There was a decrease in the exports of agricultural products and food preparations and transport equipment.
The share of goods of Estonian origin in total exports was 72% in October. The exports of goods of Estonian origin were influenced the most by a rise in the exports of mineral products (incl. shale oil, electricity) and electrical equipment. Among goods of Estonian origin, the biggest decrease occurred in the exports of agricultural products and food preparations due to decreased exports of cereals and fish, whereas the export of dried peas increased. The biggest share of goods of Estonian origin are exported to Sweden, Finland and Germany. The biggest increase in the exports of goods of Estonian origin was in the exports to Mexico, Togo and Rumania.
The main countries of consignment in October were Finland (12% of Estonia’s total imports), Germany (11%), and the Netherlands (10%). The biggest increase was in imports from the Netherlands, which doubled. Compared to October 2015, more electrical equipment and transport equipment was imported from the Netherlands. The greatest decrease occurred in imports from Finland.
In October, the main commodities imported to Estonia were electrical equipment, transport equipment, agricultural products and food preparations. The growth in imports was influenced the most by the imports of transport equipment. The biggest fall occurred in the imports of mineral products.
In October 2016, export prices increased by 3% and import prices increased by 1%.
Compared to September 2016, exports in October decreased 7% and imports stayed at the same level.
| Country of destination, group of countries | Exports, million euros | Share, % | Change compared to same month of previous year, % | Country of consignment, group of countries | Imports, million euros | Share, % | Change compared to same month of previous year, % |
|---|---|---|---|---|---|---|---|
| TOTAL | 1 029.0 | 100 | 2 | TOTAL | 1 179.7 | 100 | 3 |
| EU-28 | 766.6 | 74 | 0 | EU-28 | 992.4 | 84 | 5 |
| Euro area 19 | 488.7 | 47 | 1 | Euro area 19 | 717.2 | 61 | 7 |
| Non-EU | 262.4 | 26 | 9 | Non-EU | 187.3 | 16 | -3 |
| 1. Sweden | 168.8 | 16 | -7 | 1. Finland | 144.4 | 12 | -17 |
| 2. Finland | 166.2 | 16 | 1 | 2. Germany | 125.4 | 11 | 1 |
| 3. Latvia | 92.4 | 9 | -12 | 3. Netherlands | 120.6 | 10 | - |
| 4. Germany | 71.2 | 7 | 26 | 4. Lithuania | 109.2 | 9 | 2 |
| 5. Russia | 70.0 | 7 | 8 | 5. Sweden | 102.4 | 9 | 2 |
| 6. Lithuania | 64.9 | 6 | 6 | 6. Latvia | 100.1 | 8 | 1 |
| 7. Norway | 41.3 | 4 | -15 | 7. Poland | 79.9 | 7 | -6 |
| 8. Netherlands | 33.3 | 3 | -1 | 8. Russia | 62.4 | 5 | -1 |
| 9. Denmark | 29.7 | 3 | -1 | 9. China | 42.5 | 4 | 14 |
| 10. United Kingdom | 26.0 | 3 | -11 | 10. Italy | 30.1 | 3 | 7 |
| Commodity section (chapter) by Combined Nomenclature (CN) | Exports | Imports | Balance, million euros | ||||
|---|---|---|---|---|---|---|---|
| million euros | share, % | change compared to same period of previous year. % | million euros | share, % | change compared to same period of previous year. % | ||
| TOTAL | 1 029.0 | 100 | 2 | 1 179.7 | 100 | 3 | -150.8 |
| Agricultural products and food preparations (I–IV) | 102.1 | 10 | -14 | 127.4 | 11 | 1 | -25.3 |
| Mineral products (V) | 78.6 | 8 | 14 | 80.6 | 7 | -29 | -2.1 |
| Raw materials and products of chemical industry (VI) | 52.0 | 5 | 11 | 94.8 | 8 | 8 | -42.7 |
| Articles of plastics and rubber (VII) | 34.7 | 3 | -6 | 63.5 | 5 | 1 | -28.8 |
| Wood and articles of wood (IX) | 109.5 | 11 | 7 | 37.1 | 3 | 9 | 72.4 |
| Paper and articles thereof (X) | 33.4 | 3 | 15 | 24.8 | 2 | -2 | 8.6 |
| Textiles and textile articles (XI) | 34.8 | 3 | 8 | 58.6 | 5 | 8 | -23.8 |
| Base metals and articles of base metal (XV) | 64.1 | 6 | -7 | 97.6 | 8 | 11 | -33.4 |
| Mechanical appliances (84) | 74.4 | 7 | -3 | 108.7 | 9 | -2 | -34.3 |
| Electrical equipment (85) | 211.5 | 21 | 5 | 210.8 | 18 | -1 | 0.7 |
| Transport equipment (XVII) | 62.2 | 6 | -14 | 152.2 | 13 | 40 | -90.0 |
| Miscellaneous manufactured articles (XX) | 90.5 | 9 | -6 | 33.5 | 3 | 3 | 57.0 |
| Other | 81.0 | 8 | 36 | 90.2 | 8 | 10 | -9.3 |
The statistics are based on the questionnaires “Intrastat” and “Exports (sale of fish and crustaceans in foreign waters and ports)”, the due dates of which were, respectively, 14 and 15 November 2016, and on the customs declaration data of the Estonian Tax and Customs Board, which were sent to Statistics Estonia on 21 November 2016. Statistics Estonia published the monthly summary of foreign trade in 12 working days. In the case of the statistical activity “Foreign trade”, the main representative of public interest is the Ministry of Economic Affairs and Communications, commissioned by whom Statistics Estonia collects and analyses the data necessary for conducting the statistical activity.
As of January 2016, Statistics Estonia publishes data on the exports of goods of Estonian origin on a monthly basis. The data are available in the Statistical Database. The time series starts from 2013.