In May, the trade increased
In May, exports from Estonia amounted to 1.0 billion euros and imports to Estonia to 1.2 billion euros at current prices. The trade deficit was 159 million euros (in May 2015, it was 83 million euros) and that was increased the most by trade with Germany and the Netherlands.
The top destination country of Estonia’s exports in May was Sweden (21% of Estonia’s total exports), followed by Finland (16%) and Latvia (10%). There was an increase in exports to Sweden, Togo, Mexico and Finland, with an increase in the exports of electrical equipment, articles of wood and prefabricated wood buildings to Sweden, motor spirits to Togo, communication equipment to Mexico and mechanical appliances and prefabricated wood buildings to Finland. The biggest decrease occurred in exports to Latvia.
The biggest share in Estonia’s exports in May was held by electrical equipment, followed by wood and articles of wood and miscellaneous manufactured articles. The same chapters significantly influenced the increase in exports. In the chapter of electrical equipment, there was an increase in the exports of communication equipment and electrical transformers; in the section of miscellaneous manufactured articles, there was an increase in the exports of pillows and blankets, and prefabricated wood buildings; and in the section of wood and articles of wood, there was an increase in woodworking articles. There was a fall in the exports of mineral products, and agricultural products and food preparations.
The share of goods of Estonian origin in total exports was 73% in May. The exports of goods of Estonian origin increased the most in trade with Sweden (up by 22 million euros), Togo (up by 12 million euros), Mexico (up 9 by million euros) and Belgium (up by 8 million euros). The share of goods of Estonian origin was the largest in the exports of wood and articles of wood (98%), paper and articles thereof (92%) and miscellaneous manufactured articles (89%).
The main countries of consignment in May were Finland (13% of Estonia’s total imports), Germany (12%), Lithuania and Latvia (both 9%). Compared to May 2015, the biggest increase occurred in imports from Germany, the Netherlands and Canada. There was an increase in the import of mechanical appliances from Germany, electrical equipment from the Netherlands and transport equipment from Canada, compared to May 2015. At the same time, the greatest decrease occurred in imports from Poland.
In May, the main commodities imported were electrical equipment, transport equipment and mechanical appliances. For the second month in a row, imports increased in almost all commodity sections, except in the imports of mineral products. The rise in imports was influenced the most by increased imports of transport equipment (up by 24 million euros), mechanical appliances and electrical equipment (both up by 18 million euros).
In May compared to April, the exports of goods decreased 5% and imports 4%.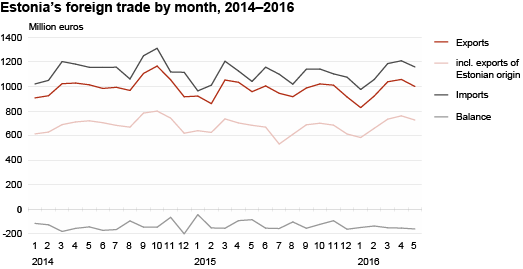
| Country of destination, group of countries | Exports, million euros | Share, % | Change compared to same month of previous year, % | Country of consignment, group of countries | Imports, million euros | Share, % | Change compared to same month of previous year, % |
|---|---|---|---|---|---|---|---|
| TOTAL | 1 000.1 | 100 | 4 | TOTAL | 1 158.8 | 100 | 11 |
| EU-28 | 756.5 | 76 | 3 | EU-28 | 964.8 | 83 | 10 |
| Euro area 19 | 457.6 | 46 | -2 | Euro area 19 | 697.5 | 60 | 12 |
| Non-EU | 243.6 | 24 | 7 | Non-EU | 194.0 | 17 | 17 |
| 1. Sweden | 206.6 | 21 | 17 | 1. Finland | 153.2 | 13 | 1 |
| 2. Finland | 163.7 | 16 | 6 | 2. Germany | 134.9 | 12 | 16 |
| 3. Latvia | 96.2 | 10 | -12 | 3. Lithuania | 109.1 | 9 | 3 |
| 4. Lithuania | 60.3 | 6 | 11 | 4. Latvia | 99.7 | 9 | 9 |
| 5. Russia | 53.2 | 5 | -13 | 5. Sweden | 96.9 | 8 | 11 |
| 6. Germany | 52.1 | 5 | 3 | 6. Netherlands | 75.0 | 6 | 28 |
| 7. Norway | 36.6 | 4 | -8 | 7. Poland | 74.1 | 6 | -8 |
| 8. USA | 35.8 | 4 | 25 | 8. Russia | 49.7 | 4 | 21 |
| 9. Denmark | 30.3 | 3 | 16 | 9. China | 48.4 | 4 | 4 |
| 10. United Kingdom | 26.2 | 3 | 7 | 10. Italy | 34.5 | 3 | 35 |
| Commodity section (chapter) by Combined Nomenclature (CN) | Exports | Imports | Balance, million euros | ||||
|---|---|---|---|---|---|---|---|
| million euros | share, % | change compared to same period of previous year. % | million euros | share, % | change compared to same period of previous year. % | ||
| TOTAL | 1 000.1 | 100 | 4 | 1 158.8 | 100 | 11 | -158.6 |
| Agricultural products and food preparations (I–IV) | 75.1 | 8 | -16 | 120.8 | 10 | 7 | -45.6 |
| Mineral products (V) | 69.9 | 7 | -25 | 93.5 | 8 | -5 | -23.6 |
| Raw materials and products of chemical industry (VI) | 49.3 | 5 | 11 | 93.6 | 8 | 15 | -44.2 |
| Articles of plastics and rubber (VII) | 34.6 | 3 | 6 | 66.4 | 6 | 11 | -31.8 |
| Wood and articles of wood (IX) | 106.9 | 11 | 8 | 41.4 | 4 | 19 | 65.5 |
| Paper and articles thereof (X) | 27.3 | 3 | 3 | 23.6 | 2 | 9 | 3.7 |
| Textiles and products thereof (XI) | 30.7 | 3 | 7 | 53.0 | 5 | 26 | -22.3 |
| Base metals and articles of base metal (XV) | 79.0 | 8 | 3 | 97.6 | 8 | 10 | -18.6 |
| Mechanical appliances (84) | 68.9 | 7 | 11 | 128.2 | 11 | 17 | -59.3 |
| Electrical equipment (85) | 238.8 | 24 | 18 | 204.6 | 18 | 9 | 34.2 |
| Transport equipment (XVII) | 65.5 | 7 | 12 | 130.5 | 11 | 22 | -65.0 |
| Miscellaneous manufactured articles (XX) | 85.7 | 9 | 12 | 30.9 | 3 | 18 | 54.8 |
| Other | 68.5 | 5 | 3 | 74.8 | 6 | 4 | -6.4 |
The statistics are based on the questionnaires “Intrastat” and “Exports (sale of fish and crustaceans in foreign waters and ports)”, the due dates of which were, respectively, 14 and 15 June 2016, and on the customs declaration data of the Estonian Tax and Customs Board, which were sent to Statistics Estonia on 20 June 2016. Statistics Estonia published the monthly summary of foreign trade in 12 working days.
As of January 2016, Statistics Estonia publishes the exports of goods of Estonian origin on a monthly basis. The data are available in the Statistical Database. The time series start from 2013.