In April, the imports of goods increased by about a tenth
In April, exports from Estonia amounted to 1.1 billion euros and imports to Estonia to 1.2 billion euros at current prices. The trade deficit was 171 million euros (in April 2015, it was 92 million euros).
The top destination country of Estonia’s exports in April was Sweden (19% of Estonia’s total exports), followed by Finland (16%) and Latvia (8%). There was an increase in exports to Sweden, Saudi Arabia, Nigeria and Denmark, with an increase in the exports of electrical equipment, prefabricated buildings and mechanical appliances to Sweden, cereals to Saudi Arabia, petroleum to Nigeria and electrical equipment and wood to Denmark. The biggest decrease occurred in exports to Turkey.
The biggest share in Estonia’s exports in April was held by electrical equipment, followed by wood and articles of wood, miscellaneous manufactured articles and agricultural products and food preparations. The rise in the exports of goods was significantly influenced by increased exports of electrical equipment and agricultural products and food preparations. In the chapter of electrical equipment, there was rise in the exports of apparatus and software for communication, and, in the section of agricultural products and food preparations, an increase in the exports of cereals. There was a fall in the exports of mineral products and base metals and articles of base metal.
The share of goods of Estonian origin in total exports was 72% in April. The exports of goods of Estonian origin increased the most in trade with Sweden (up 16 million euros), Saudi Arabia (up 10 million euros) and Kenya (up 7 million euros). The share of goods of Estonian origin was the largest in the exports of wood and articles of wood (97%), paper and paperboard (93%) and miscellaneous manufactured articles (88%).
The main countries of consignment in April were Finland (14% of Estonia’s total imports), Germany (11%) and Lithuania (9%). Compared to April 2015, the biggest increase occurred in imports from the USA, Poland and Germany. At the same time, the greatest decrease occurred in imports from Belarus and Russia. The fall in imports from these countries were influenced by a drop in the imports of mineral products and fuel components.
In April, the main commodities imported were electrical equipment, mechanical appliances and transport equipment. Imports increased in almost all commodity sections, with a drop observed only in the imports of mineral products. The rise in imports was influenced the most by increased imports of electrical equipment (up 26 million euros) and mechanical appliances (up 22 million euros).
In April compared to March, the exports of goods increased 1% and imports 3%.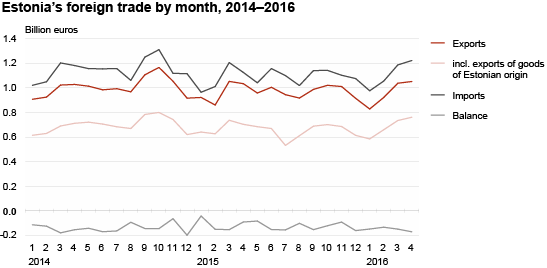
| Country of destination, group of countries | Exports, million euros | Share, % | Change compared to same month of previous year, % | Country of consignment, group of countries | Imports, million euros | Share, % | Change compared to same month of previous year, % |
|---|---|---|---|---|---|---|---|
| TOTAL | 1 051,4 | 100 | 2 | TOTAL | 1 222.2 | 100 | 9 |
| EU-28 | 766,1 | 73 | 0 | EU-28 | 1 001.7 | 82 | 10 |
| Euro area 19 | 465,9 | 44 | -3 | Euro area 19 | 703.3 | 58 | 7 |
| Non-EU | 285,3 | 27 | 5 | Non-EU | 220.5 | 18 | 4 |
| 1. Sweden | 203,0 | 19 | 10 | 1. Finland | 166.7 | 14 | 1 |
| 2. Finland | 164,0 | 16 | -1 | 2. Germany | 140.0 | 11 | 13 |
| 3. Latvia | 89,2 | 8 | -9 | 3. Lithuania | 107.0 | 9 | 9 |
| 4. Russia | 72,0 | 7 | 8 | 4. Poland | 101.0 | 8 | 22 |
| 5. Lithuania | 62,2 | 6 | 10 | 5. Latvia | 98.2 | 8 | 2 |
| 6. Germany | 59,0 | 6 | 3 | 6. Sweden | 94.3 | 8 | 4 |
| 7. Norway | 43,4 | 4 | 0 | 7. Netherlands | 75.3 | 6 | 20 |
| 8. Denmark | 35,5 | 3 | 28 | 8. Russia | 66.9 | 5 | -11 |
| 9. United Kingdom | 26,1 | 2 | -28 | 9. China | 44.6 | 4 | 1 |
| 10. Netherlands | 25,4 | 2 | -23 | 10. USA | 36.2 | 3 | 121 |
| Commodity section (chapter) by Combined Nomenclature (CN) | Exports | Imports | Balance, million euros | ||||
|---|---|---|---|---|---|---|---|
| million euros | share, % | change compared to same period of previous year. % | million euros | share, % | change compared to same period of previous year. % | ||
| TOTAL | 1 051.4 | 100 | 2 | 1 222.2 | 100 | 9 | -170.7 |
| Agricultural products and food preparations (I–IV) | 93.8 | 9 | 15 | 115.8 | 9 | 3 | -22.0 |
| Mineral products (V) | 69.8 | 7 | -38 | 103.9 | 9 | -18 | -34.0 |
| Raw materials and products of chemical industry (VI) | 49.9 | 5 | -4 | 102.6 | 8 | 0 | -52.7 |
| Articles of plastics and rubber (VII) | 35.7 | 3 | 2 | 68.8 | 6 | 14 | -33.1 |
| Wood and articles of wood (IX) | 110.6 | 11 | 6 | 38.7 | 3 | 11 | 71.9 |
| Paper and articles thereof (X) | 29.6 | 3 | 10 | 24.2 | 2 | 9 | 5.4 |
| Textiles and products thereof (XI) | 36.0 | 3 | 20 | 54.3 | 5 | 16 | -18.3 |
| Base metals and articles of base metal (XV) | 72.9 | 7 | -21 | 93.6 | 8 | 0 | -20.7 |
| Mechanical appliances (84) | 76.3 | 7 | 2 | 135.5 | 11 | 20 | -59.3 |
| Electrical equipment (85) | 237.9 | 23 | 18 | 226.0 | 18 | 13 | 11.9 |
| Transport equipment (XVII) | 66.6 | 6 | 11 | 128.6 | 11 | 19 | -62.0 |
| Miscellaneous manufactured articles (XX) | 97.8 | 9 | 8 | 29.2 | 2 | 5 | 68.6 |
| Other | 74.3 | 7 | 3 | 101.0 | 8 | 28 | -26.5 |
The statistics are based on the questionnaires “Intrastat” and “Exports (sale of fish and crustaceans in foreign waters and ports)”, the due dates of which were, respectively, 14 and 15 May 2016, and on the customs declaration data of the Estonian Tax and Customs Board, which were sent to Statistics Estonia on 20 May 2016. Statistics Estonia published the monthly summary of foreign trade in 13 working days.
As of January 2016, Statistics Estonia publishes the exports of goods of Estonian origin on a monthly basis. The data are available in the Statistical Database. The time series start from 2013.