The Estonian economy grew 2.1% in 2014
2014
In 2014, the GDP at current prices was 19.5 billion euros.
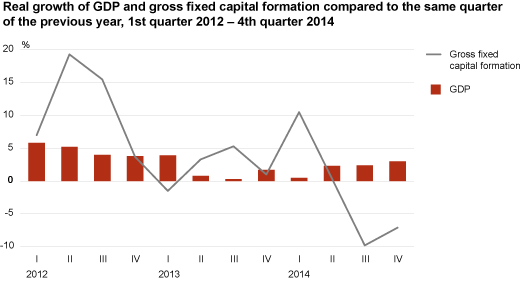
The year was characterised by a slow but steady growth of the Estonian economy. In the 1st quarter the GDP grew 0.5% compared to the 1st quarter of 2013, while in the 4th quarter the year-over-year growth was 3.0%. In total, the Estonian GDP rose 2.1% in 2014.
Trade contributed significantly to the increase in the GDP, mainly due to an increase in value added in retail trade. In addition, manufacturing and professional, scientific and technical activities contributed the most to the GDP growth in 2014. Manufacturing increased mainly due to a growth in the exports of production; there was also an increase in the domestic sales of manufacturing production.
In 2014, the decrease in value added in transportation and storage slowed the Estonian economy down the most. The decline in construction and accommodation and food service activities had a big negative effect on the GDP as well. The construction volumes on the domestic construction market decreased 2%. The value added of construction decreased 4.1% mainly due to a decrease in the construction of structures.
In 2014, the GDP grew faster than the number of hours worked and persons employed (which grew 0.4% and 0.8%, respectively). Therefore, labour productivity per employee and hour worked increased by 1.3% and 1.7%, respectively. At the same time, the labour costs related to GDP production have increased. Unit labour cost grew 6.4% compared to 2013.
Domestic demand grew 4.8%, mainly as a result of changes in inventories and an increase in household final consumption expenditures. There was an increase in all types of inventories, but the increase in the inventories of goods contributed the most to the changes in inventories. The increase in household final consumption expenditures was mostly caused by a growth in the expenditures on food, transport and clothing and footwear.
Real gross fixed capital formation fell 3%, primarily due to a decrease in investments in buildings and structures and in other machinery and equipment. The main positive factor was the growth of investments in transport. Although domestic demand grew faster than the GDP, the total final consumption expenditures, gross fixed capital formation and changes in inventories were smaller than the GDP by output method. The share of domestic demand in the GDP was 99.4%.
In 2014, the real export of goods and services grew 2.6% compared to 2013 in spite of the decrease in the 1st quarter. The import of goods and services increased 2.3% in 2014. The increased export and import of electronic products had the biggest positive impact on Estonian foreign trade.
Net export, i.e. the difference between export and import, was positive in 2014. The share of net export in the GDP was 2.5%, which was higher than in the two previous years.
4th quarter of 2014
The GDP at current prices was 5.1 billion euros in the 4th quarter of 2014. In that quarter, the seasonally and working-day adjusted GDP increased by 1.2% compared to the 3rd quarter of 2014 and by 2.9% compared to the 4th quarter of 2013.
Similarly to the 3rd quarter, the GDP in the 4th quarter of 2014 was driven the most by a rise in manufacturing, Estonia’s biggest economic activity, mainly due to the production of electronic, coke and wood products. Furthermore, the value added in energy and trade also provided important support for economic growth. The increase in value added in trade was supported by the growth of sales by retail trade enterprises.
In the 4th quarter of 2014, the value added of transportation increased at current prices. However, in real terms, transport slowed the Estonian economy down the most. In addition, the decline in the value added of real estate activities and health had a considerable negative effect on the GDP in the 4th quarter.
Domestic demand grew 5.0% in real terms, mainly due to changes in inventories and an increase in household final consumption expenditures. In the 4th quarter, the change in inventories was mainly caused by a growth in the inventories of finished goods. Household final consumption expenditures increased 5.7% at real prices. In the 4th quarter, the decrease in gross fixed capital formation, which began already in the 3rd quarter, continued. The 7% decrease in gross fixed capital formation at real prices was mostly influenced by a decrease in general government investments in buildings and structures, in other machinery and equipment and in military equipment. There was also a decrease in investments in other machinery and equipment made by the sector of non-financial corporations. In the last quarter of 2014, the real export of goods and services increased 6.0% compared to the same quarter of the previous year. At the same time, the real import of goods and services grew 5.9%. Trade was influenced the most by an increase in the export and import of electronic equipment. The share of net export in the GDP was 2.8%.
Statistics Estonia harmonised its revision policy of national accounts estimates with Eesti Pank. The table outlines the correction depth of periods to be revised in 2015.
| 1st quarter 2015 | 2nd quarter 2015 | 3rd quarter 2015 | 4th quarter 2015 | |
|---|---|---|---|---|
| Revision range | Max. three quarters | Max. one quarter | Max. 17 quarters | Max. one quarter |
| Publishing date | 11 March 2015 | 9 June 2015 | 8 September 2015 | 9 December 2015 |
| Published period | 4th quarter 2014 | 1st quarter 2015 | 2nd quarter 2015 | 3rd quarter 2015 |
| Revised period | 1st quarter 2014 up to 3rd quarter 2014, if necessary | 4th quarter 2014, if necessary | 1st quarter 2011 up to 1st quarter 2015 | 2nd quarter 2015, if necessary |
Compared to the indicators published in December 2014, GDP real growth has been revised upwards by 0.2 percentage points in the 1st quarter, by 0.4 percentage points in the 2nd quarter and by 0.2 percentage points in the 3rd quarter.