In January foreign trade decreased
The substantial decrease in trade was partially influenced by the high reference base of January 2013 caused by single transactions involving sea vessels. After eliminating these outliers, exports and imports decreased 7% in January 2014.
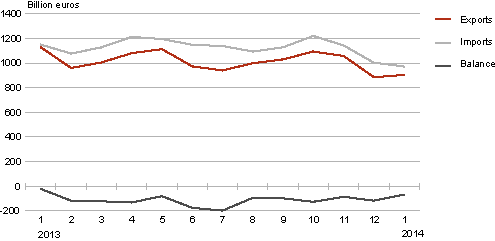
In January, exports from Estonia amounted to 904 million euros and imports to Estonia to 973 million euros at current prices. The trade deficit was 69 million euros (22 million euros in January 2013).
In January, the biggest share in Estonia’s exports was held by electrical equipment (a fifth of Estonia’s total exports), followed by agricultural products and food preparations (11%) and mineral products (10%). A significant decrease occurred in the exports of transport equipment and electrical equipment (down by 76% and 23%, respectively). At the same time, the exports of wood and products thereof increased (8%).
In January the main commodities imported were electrical equipment (18% of Estonia’s total imports), mineral products (13%) and agricultural products and food preparations (11%). The biggest decrease occurred in the imports of transport equipment (54%). There was also a substantial decrease in the imports of mineral products (incl. heavy oils, natural gas). At the same time, the imports of plastics and rubber articles increased (7%).
The top destination country of Estonia’s exports was Sweden (18% of Estonia’s total exports), followed by Finland (16%) and Latvia (11%). Electrical equipment and wood and products thereof were the main commodities exported to Sweden; electrical equipment and furniture were the main commodities exported to Finland; and mineral products (incl. electricity) and agricultural products and food preparations were the main commodities exported to Latvia. The most significant fall occurred in exports to Finland and USA (down by 51% and 35%, respectively). At the same time, exports to Latvia and the United Kingdom increased (by 10% and 38%, respectively).
In January, the main countries of consignment were Finland (17% of Estonia’s total imports), Germany (12%) and Sweden (11%). Mineral products (incl. motor spirits) and electrical equipment were the main commodities imported from Finland; transport equipment and mechanical appliances were the main commodities imported from Germany; and electrical and transport equipment were the main commodities imported from Sweden. Imports from Finland and Russia decreased the most (by 37% and 35%, respectively). Imports of goods from Germany increased by 9%.
In January 2014 compared to December 2013, exports increased by 2% and imports decreased by 3%. Export and import prices decreased by 1.5% compared to January 2013.
Estonia’s foreign trade by month, 2013–2014
| Month | Exports, million euros | Imports, million euros | Balance, million euros | |||||
|---|---|---|---|---|---|---|---|---|
| 2013 | 2014 | change, % | 2013 | 2014 | change, % | 2013 | 2014 | |
| January | 1128.6 | 904.4 | -20 | 1150.7 | 972.9 | -15 | -22.1 | -68.5 |
| Country of destination, group of countries | Exports, million euros | Share, % | Change compared to same month of previous year, % | Country of consignment, group of countries | Imports, million euros | Share, % | Change compared to same month of previous year, % |
|---|---|---|---|---|---|---|---|
| Total | 904.4 | 100 | -20 | Total | 972.9 | 100 | -15 |
| EU-28 | 653.2 | 72 | -23 | EU-28 | 797.0 | 82 | -15 |
| EA18 | 368.2 | 41 | -32 | EA18 | 480.7 | 49 | -16 |
| CIS | 104.8 | 12 | 0 | CIS | 68.1 | 7 | -32 |
| 1. Sweden | 162.3 | 18 | -6 | 1. Finland | 162.7 | 17 | -37 |
| 2. Finland | 144.7 | 16 | -51 | 2. Germany | 114.5 | 12 | 9 |
| 3. Latvia | 102.6 | 11 | 10 | 3. Sweden | 110.6 | 11 | -3 |
| 4. Russia | 92.7 | 10 | 5 | 4. Latvia | 87.5 | 9 | -10 |
| 5. Lithuania | 48.9 | 5 | -19 | 5. Lithuania | 70.5 | 7 | -25 |
| 6. Germany | 46.7 | 5 | 6 | 6. Poland | 59.8 | 6 | -23 |
| 7. Norway | 40.9 | 5 | 6 | 7. Russia | 54.4 | 6 | -35 |
| 8. USA | 28.9 | 3 | -35 | 8. China | 38.6 | 4 | -15 |
| 9. United Kingdom | 26.5 | 3 | 38 | 9. Netherlands | 30.6 | 3 | -1 |
| 10. Denmark | 22.2 | 2 | -16 | 10. United Kingdom | 29.5 | 3 | -3 |
| Commodity section (chapter) by Combined Nomenclature (CN) | Exports | Imports | Balance, million euros | ||||
|---|---|---|---|---|---|---|---|
| million euros | share, % | change compared to same period of previous year, % | million euros | share,% | change compared to same period of previous year, % | ||
| TOTAL | 904.4 | 100 | -20 | 972.9 | 100 | -15 | -68.5 |
| Agricultural products and food preparations (I–IV) | 98.1 | 11 | -7 | 107.6 | 11 | 0 | -9.5 |
| Mineral products (V) | 91.0 | 10 | -10 | 123.8 | 13 | -21 | -32.8 |
| Raw materials and products of chemical industry (VI) | 38.0 | 4 | -42 | 74.2 | 8 | -17 | -36.2 |
| Articles of plastics and rubber (VII) | 30.3 | 3 | 13 | 53.7 | 6 | 7 | -23.4 |
| Wood and products thereof (IX) | 90.8 | 10 | 10 | 27.1 | 3 | 11 | 63.7 |
| Paper and articles thereof (X) | 27.0 | 3 | 4 | 20.7 | 2 | 9 | 6.3 |
| Textiles and products thereof (XI) | 33.3 | 4 | 0 | 47.0 | 5 | -1 | -13.6 |
| Metals and products thereof (XV) | 64.2 | 7 | -9 | 80.0 | 8 | -1 | -15.8 |
| Mechanical appliances (84) | 62.9 | 7 | 11 | 86.1 | 9 | -6 | -23.2 |
| Electrical equipment (85) | 181.1 | 20 | -23 | 179.2 | 18 | -13 | 1.9 |
| Transport equipment (XVII) | 47.3 | 5 | -76 | 87.0 | 9 | -54 | -39.6 |
| Miscellaneous manufactured articles (XX) | 75.9 | 8 | 9 | 21.9 | 2 | 1 | 54.0 |
| Other | 64.3 | 8 | 11 | 64.5 | 6 | -4 | -0.2 |