In July exports of goods continued to decline
In July, exports from Estonia amounted to nearly 1 billion euros and imports to Estonia to 1.1 billion euros at current prices. Exports declined by 104 million euros and imports by 16 million euros compared to July 2012. Hence the trade deficit increased, amounting to 198 million euros in July.
The top destination countries of Estonia’s exports were Sweden (17% of Estonia’s total exports), followed by Finland (15%) and Russia (14%). The 10% decrease in total exports compared to July 2012 was mainly influenced by the decrease in the dispatches to Russia (down by 16% or 24 million euros) and United Kingdom (down by 45% or 17 million euros). The fall in exports to Russia was mainly influenced by the decline in the dispatches of mechanical appliances; at the same time, dispatches of milk and dairy products to Russia grew significantly. Exports to the United Kingdom decreased mainly due to the decrease in the dispatches of mineral fuels. Exports to Latvia and Sweden increased (by 21% and 5%, respectively).
In July, the main countries of consignment were Finland (13% of Estonia’s total imports), Germany (11%) and Sweden (11%). The one-percent decrease in total imports compared to July 2012 was mainly influenced by the decrease in the arrivals from Russia and Finland (down by 51% and 9%, respectively). Arrivals from Russia and Finland decreased mainly due to the decrease in the arrivals of mineral fuels. At the same time, arrivals of goods from Poland and Germany increased (up by 55% and 14%, respectively).
In Estonia’s exports in July, the biggest share was held by machinery and equipment (31% of Estonia’s total exports), followed by agricultural products and food preparations (10%) and mineral fuels (incl. electricity, motor spirits, oil shale) (10%). The decrease in exports compared to July 2012 was mainly influenced by the decrease in the dispatches of mineral fuels (47% decline) and metals and products thereof (33% decline). At the same time, the dispatches of wood and products thereof and agricultural products and food preparations increased (up by 32% and 10%, respectively).
In July the biggest share of Estonia’s imports was held by machinery and equipment (29% of Estonia’s total imports), followed by mineral fuels (11%) and agricultural products and food preparations (11%). Compared to July 2012, the arrivals of mineral fuels and machinery and equipment decreased (down by 32% and 6%, respectively). Arrivals of transport equipment increased by 42%, influenced also by some big-volume one-off transactions.
In July compared to June 2013, exports decreased by 4% and imports by 1%. The monthly decrease in exports was influenced by the decrease in the dispatches of miscellaneous products (incl. furniture and prefabricated wooden houses).
In July, the economic sentiment indicator, which reflects entrepreneurs’ and consumers’ confidence, increased in Estonia, Sweden, Finland and Germany. In August, the indicator continued to increase in those countries (except for Finland).
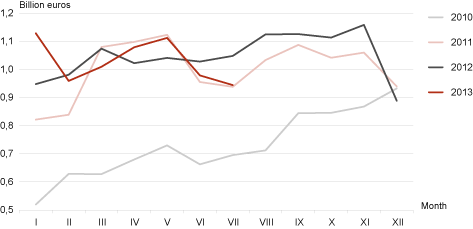
Exports of goods from Estonia, 2010–2013
| Country of destination, group of countries | Exports, million euros | Share, % | Change compared to same month of previous year, % | Country of consignment, group of countries | Imports, million euros | Share, % | Change compared to same month of previous year, % |
|---|---|---|---|---|---|---|---|
| Total | 944.2 | 100 | -10 | Total | 1 142.1 | 100 | -1 |
| EU-28 | 662.2 | 70 | -4 | EU-28 | 965.4 | 85 | 2 |
| EA | 281.6 | 30 | -6 | EA | 425.5 | 37 | 0 |
| CIS | 151.3 | 16 | -19 | CIS | 59.3 | 5 | -45 |
| 1. Sweden | 156.6 | 17 | 5 | 1. Finland | 147.8 | 13 | -9 |
| 2. Finland | 140.5 | 15 | -2 | 2. Germany | 129.9 | 11 | 14 |
| 3. Russia | 128.6 | 14 | -16 | 3. Sweden | 120.0 | 11 | -2 |
| 4. Latvia | 107.3 | 11 | 21 | 4. Poland | 107.4 | 9 | 55 |
| 5. Lithuania | 53.7 | 6 | -6 | 5. Latvia | 105.8 | 9 | -11 |
| 6. Germany | 41.0 | 4 | 5 | 6. Lithuania | 100.5 | 9 | -4 |
| 7. Belgium | 27.5 | 3 | -12 | 7. United Kingdom | 54.2 | 5 | -3 |
| 8. Norway | 27.5 | 3 | -7 | 8. Russia | 42.7 | 4 | -51 |
| 9. Netherlands | 21.1 | 2 | -17 | 9. China | 41.3 | 4 | -2 |
| 10. United Kingdom | 20.8 | 2 | -45 | 10. Netherlands | 40.5 | 4 | -24 |
| Commodity section by Combined Nomenclature (CN) | Exports | Imports | Balance, million euros | ||||
|---|---|---|---|---|---|---|---|
| million euros | share, % | change compared to same month of previous year, % | million euros | share, % | change compared to same month of previous year, % | ||
| TOTAL | 944.2 | 100 | -10 | 1 142.1 | 100 | -1 | -197.9 |
| Agricultural products and food preparations (I–IV) | 97.0 | 10 | 10 | 125.6 | 11 | 8 | -28.6 |
| Mineral products (V) | 92.4 | 10 | -47 | 128.0 | 11 | -32 | -35.7 |
| Raw materials and products of chemical industry (VI) | 53.6 | 6 | 1 | 85.0 | 7 | -9 | -31.4 |
| Articles of plastics and rubber (VII) | 33.8 | 3 | 6 | 63.1 | 6 | 9 | -29.4 |
| Wood and products thereof (IX) | 80.8 | 9 | 32 | 28.7 | 3 | 9 | 52.1 |
| Paper and articles thereof (X) | 25.1 | 3 | 12 | 21.1 | 2 | 19 | 4.0 |
| Textiles and products thereof (XI) | 31.9 | 3 | 11 | 48.3 | 4 | 13 | -16.4 |
| Metals and products thereof (XV) | 66.2 | 7 | -33 | 87.2 | 8 | -2 | -21.0 |
| Machinery and equipment (XVI) | 289.4 | 31 | -8 | 335.3 | 29 | -6 | -45.9 |
| Transport equipment (XVII) | 52.9 | 6 | 8 | 124.2 | 11 | 42 | -71.3 |
| Miscellaneous manufactured articles (XX) | 58.1 | 6 | -1 | 22.2 | 2 | 2 | 35.9 |
| Other | 63.1 | 6 | -4 | 73.5 | 6 | 21 | -10.2 |