In January trade was increased by the transport equipment
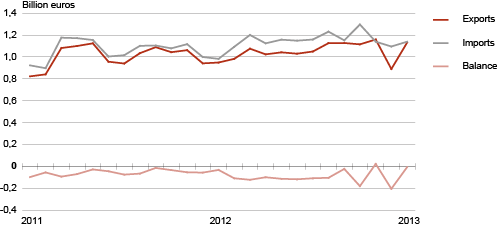
In January 2013, exports from Estonia amounted to 1.13 billion euros and imports to Estonia to 1.14 billion euros at current prices. If in January 2012 the trade deficit was registered as 34 million euros, then in January 2013 it was more than four times smaller or 8 million euros.
In Estonia’s exports the biggest share was held by machinery and equipment (26% of Estonia’s total exports), followed by transport equipment (18%) and agricultural products and food preparations (9%). The growth of Estonia’s total exports was mostly influenced by the dispatches of transport equipment, which was more than five times bigger than in January 2012. The growth in exports was also influenced by the increase in the dispatches of machinery and equipment and products of chemical industry (up by 10% and 72%, respectively). At the same time, there was a decrease in the dispatches of mineral fuels and metals and products thereof (down by 37% and 23%, respectively).
In January the biggest share of Estonia’s imports was held by machinery and equipment (26% of Estonia’s total imports), followed by transport equipment (16%) and mineral fuels incl. petrol, fuel oils and electricity (14%). Estonia’s total imports were mostly influenced by the increase in the arrivals of transport equipment (up by 130%). Arrivals of machinery and equipment and agricultural products and food preparations also increased significantly (up by 13% and 19%, respectively).
The top destination countries of Estonia’s exports were Finland (26% of Estonia’s total exports), followed by Sweden (15%) and Latvia and Russia (both 8%). Estonia’s total exports were significantly influenced by the increase in the dispatches to Finland (up by 127%) compared to January 2012. At the same time, exports to the Netherlands and USA decreased. Transport equipment made up more than half of the value of the dispatches to Finland. Machinery and equipment were the main commodities exported to Sweden and beverages and spirits to Russia.
The main countries of consignment were Finland (23% of Estonia’s total imports), followed by Sweden (10%) and Germany (9%). Imports were mostly influenced by the increase in the arrivals from Finland and Russia (the growth rate 92% and 38%, respectively). There was a slight decrease in the arrivals of goods from Germany (down by 12%). Transport equipment was mostly imported from Finland, electrical equipment from Sweden and vehicles from Germany.
Estonia’s trade increased also on monthly basis. Compared to December, exports increased by 27% and imports by 4%. Without taking into account the non-recurrent big-volumed trade transactions with transport equipment, exports increased by 10%, but imports decreased by 5%.
According to Eurostat, the economic sentiment indicator, which reflects Estonia’s entrepreneurs’ and consumers’ confidence, improved both in January and February. In February, the same indicator improved, compared to the preceding month, among all the EU countries except Latvia, Luxembourg and United Kingdom.
Estonia’s trade, 2011–2013 (months)
| Country of destination, group of countries | Exports, million euros | Share, % | Change compared to same month of previous year, % | Country of consignment, group of countries | Imports, million euros | Share, % | Change compared to same month of previous year, % |
|---|---|---|---|---|---|---|---|
| TOTAL | 1 129.8 | 100 | 19 | TOTAL | 1 137.4 | 100 | 16 |
| EU 27 | 842.2 | 75 | 37 | EU 27 | 923.1 | 81 | 21 |
| EA | 440.7 | 39 | 54 | EA | 477.0 | 42 | 32 |
| CIS | 106.5 | 9 | 12 | CIS | 99.7 | 9 | -6 |
| 1. Finland | 297.6 | 26 | 127 | 1. Finland | 257.3 | 23 | 92 |
| 2.Sweden | 173.4 | 15 | 24 | 2. Sweden | 114.0 | 10 | 27 |
| 3. Latvia | 93.5 | 8 | 28 | 3. Germany | 103.9 | 9 | -12 |
| 4. Russia | 90.1 | 8 | 16 | 4. Latvia | 96.1 | 8 | 17 |
| 5. Lithuania | 59.3 | 5 | 40 | 5. Lithuania | 90.1 | 8 | 27 |
| 6. Germany | 44.4 | 4 | -6 | 6. Russia | 82.5 | 7 | 38 |
| 7. USA | 44.4 | 4 | -26 | 7. Poland | 71.4 | 6 | -15 |
| 8. Norway | 38.7 | 3 | 40 | 8. China | 45.0 | 4 | 20 |
| 9. Denmark | 29.2 | 3 | 20 | 9. United Kingdom | 31.0 | 3 | -12 |
| 10. Netherlands | 24.4 | 2 | -50 | 10. Netherlands | 30.1 | 3 | 4 |
| Commodity section by Combined Nomenclature (CN) | Exports | Imports | Balance, million euros | ||||
|---|---|---|---|---|---|---|---|
| million euros | share, % | change compared to same month of previous year, % | million euros | share, % | change compared to same month of previous year, % | ||
| TOTAL | 1 129.8 | 100 | 19 | 1 137.4 | 100 | 16 | -7.6 |
| Agricultural products and food preparations (I–IV) | 100.8 | 9 | 29 | 104.1 | 9 | 19 | -3.3 |
| Mineral products (V) | 98.9 | 9 | -37 | 158.4 | 14 | 5 | -59.5 |
| Raw materials and products of chemical industry (VI) | 64.1 | 6 | 72 | 91.8 | 8 | 12 | -27.7 |
| Articles of plastics and rubber (VII) | 28.7 | 3 | 8 | 51.5 | 5 | 12 | -22.8 |
| Wood and products thereof (IX) | 87.0 | 8 | 22 | 24.6 | 2 | 14 | 62.4 |
| Paper and articles thereof (X) | 26.1 | 2 | -8 | 18.9 | 2 | 11 | 7.2 |
| Textiles and products thereof (XI) | 31.3 | 3 | 20 | 46.6 | 4 | 3 | -15.3 |
| Metals and products thereof (XV) | 70.3 | 6 | -23 | 82.4 | 7 | -3 | -12.1 |
| Machinery and equipment (XVI) | 292.6 | 26 | 10 | 292.8 | 26 | 13 | -0.2 |
| Transport equipment (XVII) | 201.2 | 18 | 417 | 181.7 | 16 | 130 | 19.4 |
| Miscellaneous manufactured articles (XX) | 72.2 | 6 | 16 | 21.3 | 2 | 9 | 50.9 |
| Other | 56.7 | 5 | -14 | 63.2 | 6 | -28 | -6.5 |