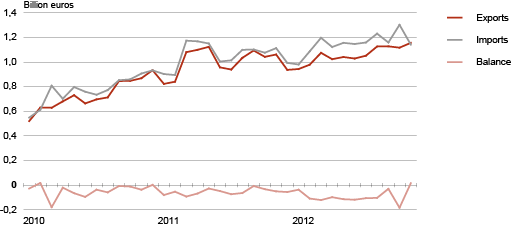
In November exports of goods exceeded imports
In November 2012 compared to November of 2011, exports of goods from Estonia grew by 9% and imports to Estonia by 3%. Due to the faster growth in exports than in imports, the trade surplus was registered. It was last in February 2010, when the trade surplus was mentioned in the monthly basis as exports exceeded imports by 17 million euros.
In November, in Estonia’s exports the biggest share was held by machinery and equipment (30% of Estonia’s total exports), followed by agricultural products and food preparations (11%) and mineral fuels (incl. motor spirits, shale oil and electricity – 11%). Compared to November 2011, the growth in exports was mainly influenced by the increase in the dispatches of machinery and equipment (up by 35%). Dispatches of agricultural products and food preparations increased by a fifth. At the same time, exports of mineral fuels decreased (down by 26%).
In November the biggest share of Estonia’s imports was also held by machinery and equipment (32% of Estonia’s total imports), followed by agricultural products and food preparations (11%) and mineral fuels (11%). Compared to November 2011, there was a significant increase in the arrivals of machinery and equipment (up by 32%). At the same time, the arrivals of mineral fuels decreased by a third.
The biggest share of commodities was exported to Sweden (18% of Estonia’s total exports), followed by Russia (14%) and Finland (13%). Compared to November 2011, the increase in total exports was mostly influenced by the increase in the dispatches to Sweden and Russia (up by 78% and 13%, respectively). At the same time, exports to the USA and Finland decreased (down by 44% and 8%, respectively). Electrical equipment, wood and furniture were the main commodities exported to Sweden and Finland; mechanical equipment, beverages and alcohol and organic chemicals to Russia.
The main countries of consignment were Finland (14% of Estonia’s total imports), Sweden and Germany (11% from both). The increase in the total imports was mostly influenced by the increase in the arrivals from China (twofold or up by 109%) and Lithuania (up by 23%). At the same time, imports from Latvia and the Netherlands decreased. Electrical equipment and fuels were the main commodities imported from Finland, electrical equipment and transport equipment from Sweden and mechanical and electrical equipment from Germany. Imports from China increased mainly due to the increase in the arrivals of electrical equipment.
Compared to October 2012, exports increased by 3%, but imports decreased by 12%. Exports increased due to the increase in the dispatches of machinery and equipment and products of chemical industry. Imports declined mainly due to the decrease in the arrivals of machinery and equipment and mineral fuels.
In November 2012, export prices were at the same level as in November 2011, but import prices rose by 2%.
Estonia’s trade, 2010–2012
| Country of destination, group of countries | Exports, million euros | Share, % | Change compared to same month of previous year, % | Country of consignment, group of countries | Imports, million euros | Share, % | Change compared to same month of previous year, % |
|---|---|---|---|---|---|---|---|
| Total | 1 154.6 | 100 | 9 | Total | 1 139.2 | 100 | 3 |
| EU27 | 774.0 | 67 | 15 | EU27 | 938.1 | 82 | 3 |
| EA | 305.7 | 26 | -4 | EA | 433.2 | 38 | 1 |
| CIS | 192.1 | 17 | 12 | CIS | 82.9 | 7 | -17 |
| 1. Sweden | 212.9 | 18 | 78 | 1. Finland | 157.7 | 14 | 1 |
| 2. Russia | 167.3 | 14 | 13 | 2. Sweden | 121.7 | 11 | 16 |
| 3. Finland | 154.1 | 13 | -8 | 3. Germany | 121.6 | 11 | 11 |
| 4. Latvia | 101.7 | 9 | 4 | 4. Latvia | 112.9 | 10 | -17 |
| 5. Lithuania | 64.6 | 6 | 23 | 5. Lithuania | 98.6 | 9 | 23 |
| 6. Norway | 51.4 | 4 | 49 | 6. Poland | 69.1 | 6 | 6 |
| 7. Germany | 50.5 | 4 | 2 | 7. Russia | 67.7 | 6 | -8 |
| 8. Denmark | 39.5 | 3 | 36 | 8. United Kingdom | 49.8 | 4 | -7 |
| 9. USA | 35.3 | 3 | -44 | 9. Netherlands | 46.6 | 4 | -26 |
| 10. Belgium | 27.9 | 2 | 104 | 10. China | 45.3 | 4 | 109 |
| Commodity section by Combined Nomenclature (CN) | Exports | Imports | Balance, million euros | ||||
|---|---|---|---|---|---|---|---|
| million euros | share, % | change compared to same month of previous year, % | million euros | share, % | change compared to same month of previous year, % | ||
| TOTAL | 1 154.6 | 100 | 9 | 1 139.2 | 100 | 3 | 15.4 |
| Agricultural products and food preparations (I–IV) | 130.9 | 11 | 20 | 125.6 | 11 | 10 | 5.4 |
| Mineral products (V) | 128.4 | 11 | -26 | 121.7 | 11 | -33 | 6.7 |
| Raw materials and products of chemical industry (VI) | 71.4 | 6 | 29 | 101.0 | 9 | -5 | -29.6 |
| Articles of plastics and rubber (VII) | 32.5 | 3 | 2 | 59.0 | 5 | 11 | -26.5 |
| Wood and products thereof (IX) | 88.7 | 8 | 14 | 27.9 | 3 | 21 | 60.9 |
| Paper and articles thereof (X) | 30.5 | 3 | 14 | 23.9 | 2 | 14 | 6.6 |
| Textiles and products thereof (XI) | 31.8 | 3 | -2 | 52.5 | 5 | 11 | -20.6 |
| Metals and products thereof (XV) | 76.9 | 7 | -25 | 82.9 | 7 | -18 | -5.9 |
| Machinery and equipment (XVI) | 351.5 | 30 | 35 | 366.8 | 32 | 32 | -15.3 |
| Transport equipment (XVII) | 56.8 | 5 | 9 | 85.3 | 7 | -16 | -28.5 |
| Miscellaneous manufactured articles (XX) | 81.8 | 7 | 12 | 27.0 | 2 | 10 | 54.8 |
| Other | 73.3 | 6 | 13 | 65.7 | 6 | 11 | 7.6 |