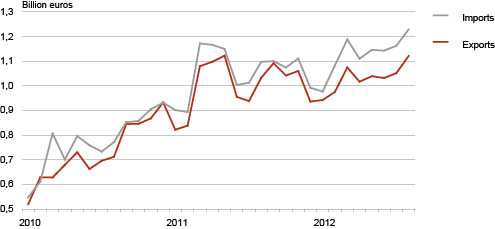
In August imports were record high
In August 2012, exports of goods from Estonia increased by 8% at current prices and imports to Estonia by 12% compared to August of the previous year. The trade deficit was registered as 108 million euros, which was 1.7 times bigger than in August of the previous year.
The biggest share of commodities was exported to Russia (16% of Estonia’s total exports), followed by Sweden and Finland (15% to both). Compared to August 2011, the increase in total exports was mostly influenced by the increase in the dispatches to Russia (up by 28%) and Belgium (up 2.7 times, mainly by the increase of dispatches of oil shale). Exports to Sweden decreased by 4%. Mechanical and electrical equipment and beverages and spirits were the main commodities exported to Russia; electrical equipment, fuels, wood and products of wood to Sweden and electrical equipment, furniture and articles of iron and steel to Finland.
The main countries of consignment were Finland (15% of Estonia’s total imports), Sweden (12%) and Lithuania (10%). The increase in total imports was mostly influenced by the increase in the arrivals from Finland and Sweden (up by 36% and 31%, respectively). At the same time, imports from Germany decreased by 10%. Fuels, ships and electrical equipment were the main commodities imported from Finland, electrical equipment and transport equipment from Sweden, and fuels from Lithuania.
In Estonia’s exports in August, the biggest share was held by machinery and equipment (28% of Estonia’s total exports), followed by mineral fuels (incl. motor spirits, shale oils and electricity – 13%) and agricultural products and food preparations (9%). The increase in exports compared to August 2011 was mainly influenced by the increase in the dispatches of mineral fuels and agricultural products and food preparations.
In August the biggest share of Estonia’s imports was held by machinery and equipment (30% of Estonia’s total imports), followed by mineral fuels (14%) and agricultural products and food preparations (10%). There was a significant increase in the arrivals of machinery and equipment and transport equipment (up by 16% and 64%, respectively) compared to August of the previous year. Arrivals of metals and products thereof decreased by 6%.
Compared to July this year, exports increased by 7% and imports by 6%. The growth in exports was influenced by the increase in the dispatches of wood and products thereof, the growth of imports by the increase in the arrivals of electrical equipment.
The economic sentiment indicator, which reflects Estonia’s entrepreneurs’ and consumers’ confidence, improved in August, but deteriorated again in September. According to Eurostat, in September the same indicator deteriorated in Sweden and Germany, but improved in Finland.
Estonian trade by months, 2010–2012
| Country of destination, group of countries | Exports, million euros | Share, % | Change compared to same month of previous year, % | Country of consignment, group of countries | Imports, million euros | Share, % | Change compared to same month of previous year, % |
|---|---|---|---|---|---|---|---|
| Total | 1 120.6 | 100 | 8 | Total | 1 228.3 | 100 | 12 |
| EU27 | 727.4 | 65 | 4 | EU27 | 1 008.0 | 82 | 12 |
| EA | 319.3 | 28 | 6 | EA | 463.5 | 38 | 18 |
| CIS | 203.8 | 18 | 26 | CIS | 103.6 | 8 | 31 |
| 1. Russia | 178.0 | 16 | 28 | 1. Finland | 183.7 | 15 | 36 |
| 2. Sweden | 172.5 | 15 | -4 | 2. Sweden | 149.4 | 12 | 31 |
| 3. Finland | 170.1 | 15 | 3 | 3. Lithuania | 119.3 | 10 | 4 |
| 4. Latvia | 99.6 | 9 | 4 | 4. Latvia | 115.6 | 9 | -2 |
| 5. Lithuania | 62.7 | 6 | 22 | 5. Germany | 114.2 | 9 | -10 |
| 6. USA | 44.5 | 4 | 9 | 6. Poland | 74.1 | 6 | 0 |
| 7. Germany | 44.1 | 4 | 7 | 7. Russia | 73.0 | 6 | 29 |
| 8. Norway | 39.5 | 4 | 18 | 8. Netherlands | 72.8 | 6 | 56 |
| 9. Belgium | 31.7 | 3 | 169 | 9. China | 46.0 | 4 | -6 |
| 10. Denmark | 24.8 | 2 | 31 | 10. United Kingdom | 37.3 | 3 | 39 |
| Commodity section by Combined Nomenclature (CN) | Exports | Imports | Balance, million euros | ||||
|---|---|---|---|---|---|---|---|
| million euros | Share, % | change compared to same month of previous year, % | million euros | Share, % | change compared to same month of previous year, % | ||
| TOTAL | 1 120.6 | 100 | 8 | 1 228.3 | 100 | 12 | -107.7 |
| Agricultural products and food preparations (I–IV) | 102.4 | 9 | 19 | 120.3 | 10 | 17 | -17.9 |
| Mineral products (V) | 148.0 | 13 | 19 | 175.7 | 14 | 4 | -27.7 |
| Raw materials and products of chemical industry (VI) | 70.4 | 6 | 29 | 97.9 | 8 | 3 | -27.5 |
| Articles of plastics and rubber (VII) | 37.1 | 3 | 11 | 62.5 | 5 | 12 | -25.4 |
| Wood and products thereof (IX) | 83.3 | 7 | 17 | 27.7 | 2 | 8 | 55.6 |
| Paper and articles thereof (X) | 27.5 | 3 | -1 | 20.9 | 2 | 8 | 6.6 |
| Textiles and products thereof (XI) | 35.1 | 3 | 9 | 53.4 | 4 | 5 | -18.3 |
| Metals and products thereof (XV) | 96.4 | 9 | 2 | 93.8 | 8 | -6 | 2.6 |
| Machinery and equipment (XVI) | 317.7 | 28 | 1 | 372.5 | 30 | 16 | -54.8 |
| Transport equipment (XVII) | 53.2 | 5 | 5 | 108.0 | 9 | 64 | -54.8 |
| Miscellaneous manufactured articles (XX) | 74.9 | 7 | 12 | 25.5 | 2 | 39 | 49.4 |
| Other | 74.6 | 7 | -2 | 70.1 | 6 | -4 | 4.5 |