In February imports of goods increased by a quarter compared to the previous year
In February 2012, exports from Estonia amounted to 0.97 billion euros and imports to Estonia to 1.11 billion euros at current prices. The foreign trade deficit increased nearly three times. The trade deficit was registered as 138 million euros, compared to 51 million euros in February 2011.
In Estonia’s exports in February, the biggest share was held by machinery and equipment (28% of Estonia’s total exports), followed by mineral products (incl. petrol, shale oils and electricity (20%) and metals and products thereof (8%). In February 2012 compared to February 2011, the turnover of exports increased in all main commodity sections. The biggest increase was mentioned in the dispatches of mineral products and machinery and equipment (the growth rate 32% and 10%, respectively).
In February the biggest share of Estonia’s imports was held by machinery and equipment (23% of Estonia’s total imports), followed by mineral products (20%) and transport equipment (9%). Also, the turnover of imports increased in all main commodity sections compared to February 2011. Estonia’s total imports were mostly influenced by an increase in the arrivals of mineral products and transport equipment (the growth rate 31% and 56%, respectively).
The top destination countries of Estonia’s exports were Sweden (17% of Estonia’s total exports), followed by Finland (14%) and Russia (10%). Estonia’s total exports were mostly influenced by an increase in the dispatches to Nigeria and USA compared to February 2011 (mainly light and fuel oils). Commodities of electrical equipment were the main commodities exported to Sweden and Finland, while mechanical equipment was the main commodity exported to Russia.
The main countries of consignment were Finland and Germany (both 14% of Estonia’s total imports), and Latvia (10%). In February, arrivals of goods from Finland and Germany increased the most (the growth rate 47% and 58%, respectively). Arrivals of goods from Russia decreased by 29%, mainly influenced by the decrease in the arrivals of fuels. Fuels were the main commodities imported from Finland and Latvia. Goods registered under the chapter of industrial plant were the most common commodity imported from Germany.
In February 2012 compared to January 2012, exports increased by 3% and imports by 10%. According to the data of Eurostat, the economic sentiment indicator, which reflects Estonia’s entrepreneurs’ and consumers’ confidence, also increased in February compared to January. In Estonia, as well as in Sweden, the same indicator improved also in March, but in Finland the respective indicator declined.
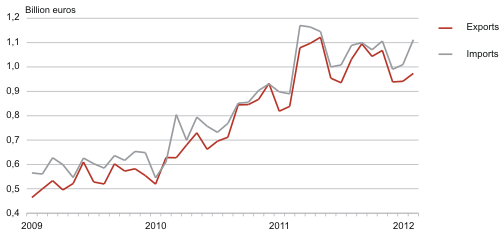
Estonia’s trade by months, 2009–2012
| Country of destination, group of countries | Exports, million euros | Share, % | Change compared to same month of previous year, % | Country of consignment, group of countries | Imports, million euros | Share, % | Change compared to same month of previous year, % |
|---|---|---|---|---|---|---|---|
| Total | 973.8 | 100 | 16 | Total | 1 111.7 | 100 | 25 |
| EU 27 | 614.4 | 63 | 10 | EU 27 | 901.8 | 81 | 34 |
| EA 17 | 263.2 | 27 | 4 | EA 17 | 429.4 | 39 | 42 |
| CIS | 118.3 | 12 | 14 | CIS | 111.9 | 10 | -13 |
| 1. Sweden | 169.7 | 17 | 15 | 1. Finland | 156.7 | 14 | 47 |
| 2. Finland | 138.4 | 14 | 13 | 2. Germany | 151.1 | 14 | 58 |
| 3. Russia | 95.8 | 10 | 16 | 3. Latvia | 108.5 | 10 | 35 |
| 4. USA | 81.2 | 8 | 59 | 4. Lithuania | 103.2 | 9 | 55 |
| 5. Latvia | 69.7 | 7 | 36 | 5. Sweden | 101 | 9 | -1 |
| 6. Germany | 46.3 | 5 | 20 | 6. Poland | 80.2 | 7 | 33 |
| 7. Lithuania | 43.8 | 4 | 13 | 7. Russia | 68.6 | 6 | -29 |
| 8. Nigeria | 34.4 | 4 | - | 8. China | 38.2 | 3 | 4 |
| 9. Morocco | 27.9 | 3 | - | 9. United Kingdom | 34.9 | 3 | 10 |
| 10. Norway | 26.8 | 3 | 19 | 10. Netherlands | 29.9 | 3 | -8 |
| Commodity section by Combined Nomenclature (CN) | Exports | Imports | Balance, million euros | ||||
|---|---|---|---|---|---|---|---|
| million euros | share, % | change compared to same month of previous year, % | million euros | share, % | change compared to same month of previous year, % | ||
| TOTAL | 973.8 | 100 | 16 | 1 111.7 | 100 | 25 | -137.9 |
| Agricultural products and food preparations (I–IV) | 69.1 | 7 | 3 | 92.5 | 8 | 4 | -23.4 |
| Mineral products (V) | 191.5 | 20 | 32 | 223.0 | 20 | 31 | -31.5 |
| Raw materials and products of chemical industry (VI) | 40.3 | 4 | 30 | 79.7 | 7 | 27 | -39.4 |
| Articles of plastics and rubber (VII) | 27.1 | 3 | 12 | 50.1 | 5 | 5 | -23 |
| Wood and products thereof (IX) | 70.8 | 7 | 6 | 25.2 | 2 | 9 | 45.6 |
| Paper and articles thereof (X) | 25.7 | 3 | 12 | 18.1 | 2 | 9 | 7.6 |
| Textiles and products thereof (XI) | 30.9 | 3 | 8 | 46.3 | 4 | 10 | -15.4 |
| Metals and products thereof (XV) | 77.5 | 8 | 22 | 90.2 | 8 | 3 | -12.7 |
| Machinery and equipment (XVI) | 272.2 | 28 | 10 | 250.2 | 23 | 10 | 22 |
| Transport equipment (XVII) | 45.3 | 5 | 12 | 94.6 | 9 | 56 | -49.3 |
| Miscellaneous manufactured articles (XX) | 61.6 | 6 | 12 | 20.6 | 2 | 29 | 41 |
| Other | 61.8 | 6 | 31 | 121.2 | 10 | 170 | -59.4 |