In January exports grew faster than imports
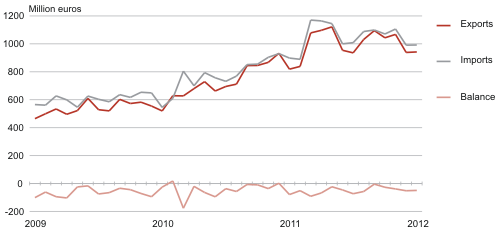
In January 2012 exports from Estonia amounted to 942 million euros and imports to Estonia to 992 million euros at current prices. The trade deficit was registered as nearly 50 million euros, compared to 79 million euros in January 2011.
In Estonia’s exports the biggest share was held by machinery and equipment (28% of Estonia’s total exports), followed by mineral products incl. petrol, fuel oils and electricity (16%) and metals and products thereof (10%). The growth of Estonia’s total exports was mostly influenced by the dispatches of machinery and equipment, which increased by 19% compared to January 2011. Growth in exports was also influenced by an increase in the dispatches of metals and products thereof (up 52%). There was a slight decrease in the dispatches of textile products (down 8%).
In January the biggest share of Estonia’s imports was held by machinery and equipment (26% of Estonia’s total imports), followed by mineral products (15%) and agricultural products and food preparations (9%). Estonia’s total imports were mostly influenced by an increase in the arrivals of machinery and equipment, which grew by 17% compared to January 2011. Arrivals of raw materials and products of chemical industry also increased significantly. Arrivals of transport equipment decreased by 23%.
The top destination countries of Estonia’s exports were Sweden (15% of Estonia’s total exports), Finland (14%) and Russia (8%). Estonia’s total exports were mostly influenced by an increase in the dispatches to the Netherlands and USA compared to January 2011 (growth rate 64% and 144%, respectively). Exports to Sweden decreased by 11%. Electrical equipment, wood and products thereof and miscellaneous manufactured articles (incl. furniture) were the main commodities exported to Sweden and Finland, while mechanical equipment was the main commodity exported to Russia.
The main countries of consignment were Germany (14% of Estonia’s total imports), Finland (13%) and Sweden (9%). Imports increased the most from the countries with the biggest share in Estonia’s total imports – Germany and Finland (growth rate 76% and 45%, respectively). Arrivals of goods from Russia decreased by 27%. Goods registered under the chapter of industrial plant were the most common commodity imported from Germany, fuels from Finland and electrical equipment from Sweden.
In January 2012, compared to December 2011, exports and imports remained on the same level. According to Eurostat, the economic sentiment indicator, which reflects Estonia’s entrepreneurs’ and consumers’ confidence, also remained on the same level. In Estonia, as well as in Sweden and Finland, the same indicator improved somewhat in February.
Estonia’s trade by months, 2009–2012
| Country of destination, group of countries | Exports, million euros | Share, % | Change compared to same month of previous year, % | Country of consignment, group of countries | Imports, million euros | Share, % | Change compared to same month of previous year, % |
|---|---|---|---|---|---|---|---|
| TOTAL | 942.4 | 100 | 15 | TOTAL | 991.9 | 100 | 10 |
| EU 27 | 607.9 | 65 | 5 | EU 27 | 776.9 | 78 | 23 |
| EA17 | 284.7 | 30 | 7 | EA17 | 379.8 | 38 | 44 |
| CIS | 97.5 | 10 | 20 | CIS | 105.9 | 11 | -9 |
| 1. Sweden | 142.6 | 15 | -11 | 1. Germany | 142.9 | 14 | 76 |
| 2. Finland | 135.4 | 14 | 12 | 2. Finland | 133.5 | 13 | 45 |
| 3. Russia | 79.4 | 8 | 28 | 3. Sweden | 89.1 | 9 | -7 |
| 4. Latvia | 70.0 | 7 | 34 | 4. Poland | 82.8 | 8 | 41 |
| 5. USA | 60.1 | 6 | 64 | 5. Latvia | 79.0 | 8 | -15 |
| 6. Netherlands | 48.3 | 5 | 144 | 6. Lithuania | 69.3 | 7 | -7 |
| 7. Germany | 43.9 | 5 | 16 | 7. Russia | 59.5 | 6 | -27 |
| 8. Lithuania | 40.6 | 4 | 6 | 8. China | 37.4 | 4 | -8 |
| 9. Norway | 27.8 | 3 | 3 | 9. United Kingdom | 34.7 | 3 | 109 |
| 10. Turkey | 25.2 | 3 | 204 | 10. Belarus | 30.7 | 3 | 223 |
| Commodity section by Combined Nomenclature (CN) | Exports | Imports | Balance, million euros | ||||
|---|---|---|---|---|---|---|---|
| million euros | share, % | change compared to same month of previous year, % | million euros | share, % | change compared to same month of previous year, % | ||
| TOTAL | 942.4 | 100 | 15 | 991.9 | 100 | 10 | -49.5 |
| Agricultural products and food preparations (I–IV) | 76.5 | 8 | 6 | 84.7 | 9 | 6 | -8.2 |
| Mineral products (V) | 155.9 | 16 | 10 | 150.9 | 15 | -20 | 5.0 |
| Raw materials and products of chemical industry (VI) | 36.5 | 4 | 21 | 80.3 | 8 | 47 | -43.8 |
| Articles of plastics and rubber (VII) | 26.9 | 3 | 15 | 44.8 | 5 | 8 | -17.9 |
| Wood and products thereof (IX) | 72.4 | 8 | 6 | 21.2 | 2 | 1 | 51.2 |
| Paper and articles thereof (X) | 28.3 | 3 | 9 | 17 | 2 | 1 | 11.3 |
| Textiles and products thereof (XI) | 25.3 | 3 | -8 | 44.6 | 4 | 9 | -19.3 |
| Metals and products thereof (XV) | 90.6 | 10 | 52 | 82.2 | 8 | 7 | 8.4 |
| Machinery and equipment (XVI) | 267.1 | 28 | 19 | 255.1 | 26 | 17 | 12.0 |
| Transport equipment (XVII) | 37.2 | 4 | -5 | 76.8 | 8 | -23 | -39.6 |
| Miscellaneous manufactured articles (XX) | 61.9 | 6 | 10 | 18.8 | 2 | 36 | 43.1 |
| Other | 63.8 | 7 | 30 | 115.5 | 11 | 155 | -51.3 |