In May the trade deficit was the smallest of the year
In May 2011, the exports of goods from Estonia amounted to 1.12 billion euros and imports to Estonia to 1.14 billion euros. Exports of goods exceeded the highest turnover so far or the turnover of April this year. The foreign trade deficit accounted for 24 million euros (62 million euros in May 2010).
In Estonia’s exports in May the biggest shares were held by machinery and equipment (25% of Estonia’s total exports), mineral products (incl. motor spirits, fuel oils and electricity) – 24% and wood and products thereof (8%). Compared to May 2010, exports of machinery and equipment and mineral products increased the most, both two times.
In May the biggest shares of Estonia’s imports were held by machinery and equipment (26% of Estonia’s total imports), mineral products (18%), and agricultural products and food preparations (10%). Compared to May 2010, arrivals of machinery and equipment and transport equipment increased the most (both nearly two times). Arrivals of metals and products thereof also increased significantly (53%).
The first place among destination countries of exports was held by Finland (14% of Estonia’s total exports), followed by Sweden (14%) and USA (10%). Compared to May 2010, exports increased the most to Nigeria and Sweden (by 78 and 65 million euros, respectively). Electrical equipment, wood and products thereof and furniture were mainly exported to Finland as well as to Sweden. Fuels were mainly exported to the USA and Nigeria.
The largest amounts of goods were imported from Finland (12% of Estonia’s total imports), followed by Germany and Latvia (11% and 10%, respectively). During the year, arrivals of goods from Latvia and Germany have increased the most (41 and 38 million euros, respectively). From Finland, mainly electrical equipment was imported, from Germany – vehicles and parts thereof, and from Latvia – fuels.
In May compared to April, exports increased by 1%, but imports decreased by 2%.
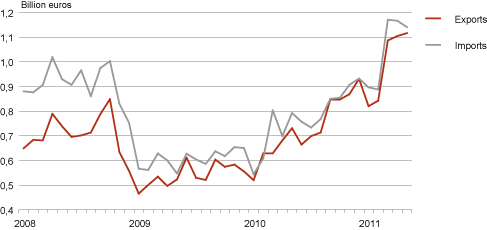
Estonia’s trade by months, 2008–2011
| Month | Exports, million euros | Imports, million euros | Balance, million euros | |||||
| 2010 | 2011 | change, % | 2010 | 2011 | change, % | 2010 | 2011 | |
| January | 519.5 | 819.2 | 58 | 543.3 | 896.0 | 65 | -23.8 | -76.8 |
| February | 628.7 | 841.9 | 34 | 608.3 | 887.4 | 46 | 20.4 | -45.5 |
| March | 628.6 | 1 086.3 | 73 | 802.3 | 1 170.1 | 46 | -173.7 | -83.9 |
| April | 680.7 | 1 104.0 | 62 | 697.9 | 1 166.1 | 67 | -17.2 | -62.1 |
| May | 730.0 | 1 116.0 | 53 | 791.8 | 1 140.4 | 44 | -61.7 | -24.4 |
| Country of destination, group of countries | Exports, million euros | Share, % | Change compared to same month of previous year, % | Country of consignment, group of countries | Imports, million euros | Share, % | Change compared to same month of previous year, % |
|---|---|---|---|---|---|---|---|
| Total | 1 116.0 | 100 | 53 | Total | 1 140.4 | 100 | 44 |
| EU27 | 677.5 | 61 | 42 | EU27 | 868.1 | 76 | 39 |
| EA17 | 320.5 | 29 | 43 | EA17 | 393.0 | 34 | 30 |
| CIS | 120.3 | 11 | 64 | CIS | 131.3 | 12 | 26 |
| 1. Finland | 160.2 | 14 | 22 | 1. Finland | 137.0 | 12 | 19 |
| 2. Sweden | 155.2 | 14 | 71 | 2. Germany | 126.6 | 11 | 43 |
| 3. USA | 109.8 | 10 | 94 | 3. Latvia | 117.8 | 10 | 54 |
| 4. Nigeria | 96.5 | 9 | 433 | 4. Sweden | 97.9 | 9 | 34 |
| 5. Russia | 95.6 | 9 | 61 | 5. Russia | 94.8 | 8 | 19 |
| 6. Latvia | 68.8 | 6 | 13 | 6. Lithuania | 91.3 | 8 | 8 |
| 7. Germany | 50.5 | 5 | 28 | 7. Poland | 75.0 | 7 | 58 |
| 8. Lithuania | 46.9 | 4 | 20 | 8. China | 47.7 | 4 | 140 |
| 9. France | 41.3 | 4 | 199 | 9. United Kingdom | 44.1 | 4 | 259 |
| 10. Norway | 35.4 | 3 | 68 | 10. Norway | 39.7 | 3 | 609 |
| Commodity section by Combined Nomenclature (CN) | Exports | Imports | Balance, million euros | ||||
|---|---|---|---|---|---|---|---|
| million euros | share, % | change compared to same month of previous year, % | million euros | share, % | change compared to same month of previous year, % | ||
| TOTAL | 1 116.0 | 100 | 53 | 1 140.4 | 100 | 44 | -24.4 |
| Agricultural products and food preparations (I–IV) | 83.9 | 8 | 24 | 113.8 | 10 | 31 | -29.9 |
| Mineral products (V) | 268.3 | 24 | 98 | 210.8 | 18 | 15 | 57.5 |
| Raw materials and products of chemical industry (VI) | 44.9 | 4 | 48 | 80.3 | 7 | 33 | -35.4 |
| Articles of plastics and rubber (VII) | 30.9 | 3 | 39 | 56.5 | 5 | 31 | -25.6 |
| Wood and products thereof (IX) | 92.0 | 8 | 33 | 30.2 | 3 | 24 | 61.8 |
| Paper and articles thereof (X) | 27.7 | 2 | 18 | 20.5 | 2 | 18 | 7.2 |
| Textiles and products thereof (XI) | 26.2 | 2 | 11 | 44.7 | 4 | 23 | -18.5 |
| Metals and products thereof (XV) | 84.9 | 8 | -1 | 103.3 | 9 | 53 | -18.4 |
| Machinery and equipment (XVI) | 274.4 | 25 | 98 | 298.9 | 26 | 86 | -24.5 |
| Transport equipment (XVII) | 63.0 | 6 | 60 | 111.1 | 10 | 94 | -48.1 |
| Miscellaneous manufactured articles (XX) | 69.9 | 6 | 27 | 20.9 | 2 | 26 | 49.0 |
| Other | 49.9 | 4 | 27 | 49.4 | 4 | 29 | 0.5 |