In February the rapid growth of industrial production continued
The situation in the manufacturing did not change during February – the rapid growth of industrial production which had begun at the end of 2010 continued. The growth of production has been mainly influenced by the increase in external demand as previously, but the domestic demand also increased compared to February of the previous year.
In February 2011, the production of manufacturing increased 42% compared to February 2010. Export sales of the manufacturing production grew significantly (71%). About three quarters (73%) of the whole production of manufacturing was sold on the external market. The demand on the domestic market was continually lower – the domestic sales increased 14% compared to February of the previous year.
In February, the production exceeded the volume of the previous year in most branches of industry. The manufacturing of electronic products where the production increased by more than four times compared to February of the previous year, obtained the biggest share in manufacturing (almost a quarter) over the year. The next branches holding bigger shares were the manufacturing of wood and metal products where the production grew 18% and 49%, respectively. With respect to the branches of manufacturing holding smaller shares, the production increased considerably in the manufacturing of chemicals, motor vehicles, machinery and equipment mainly due to the increase in exports.
In February 2011 compared to January, the seasonally adjusted industrial production remained on the same level; the production of manufacturing grew 1%.
In February 2011 compared to February 2010, the production of electricity did not change and the production of heat increased 4%.
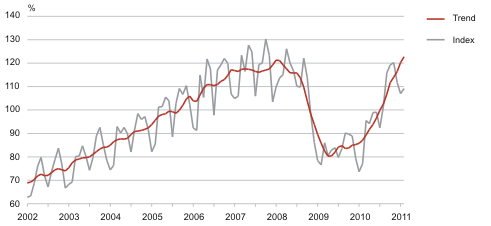
The volume index and trend of production in manufacturing, January 2002 – February 2011 (2005 = 100)
| Economic activity | change compared to the previous month according to seasonally adjusted dataa | change compared to the corresponding month of the previous year | |
|---|---|---|---|
| according to unadjusted data | according to working-day adjusted datab | ||
| TOTAL | -0.1 | 31.4 | 31.4 |
| Energy production | -4.0 | 1.6 | 1.6 |
| Mining | -1.0 | 5.8 | 5.8 |
| Manufacturing | 0.7 | 41.6 | 41.6 |
| manufacture of food products | 0.5 | -1.1 | -1.1 |
| manufacture of wood and wood products | -2.8 | 17.8 | 17.8 |
| manufacture of fabricated metal products | -0.1 | 48.5 | 48.5 |
| manufacture of computer, electronic and optical products | 9.2 | 318.5 | 318.5 |
| manufacture of electrical equipment | -1.8 | 14.3 | 14.3 |
| manufacture of chemicals and chemical products | 1.3 | 52.9 | 52.9 |
| manufacture of motor vehicles | -6.3 | 56.6 | 56.6 |
| manufacture of machinery and equipment | 6.6 | 57.9 | 57.9 |
| manufacture of rubber and plastic products | 2.2 | 17.5 | 17.5 |
| manufacture of building materials | 1.4 | -0.3 | -0.3 |