Rapid increase of industrial production continued in July
The moderate growth reported at the beginning of 2010 was followed by a rapid increase — in April enterprises gave 19%, in May 17% and in and June 21% more production than in the corresponding months of 2009.
The production of manufacturing increased 23% compared to July of the previous year. In July, export sales of the manufacturing production increased significantly (38%). In July, nearly two thirds of the whole production of manufacturing was sold on the external market. The demand on the domestic market was still low and the domestic sales were equal compared to July of the previous year.
In July, production exceeded the previous year’s level in most branches of industry. The growth in the production of manufacturing was most influenced by the branches holding bigger shares — manufacturing of electronic products where the production increased by more than three times, and manufacturing of wood where the growth was 38%. With respect to the branches of manufacturing holding smaller shares, the production increased considerably in the manufacturing of motor vehicles, machinery and equipment, metals and pharmaceuticals, mainly due to the increase in exports. The rapid growth in production was partly also influenced by the low reference base in 2009; this effect will last until the end of 2010. The production of refined petroleum products, metal products, and the production in the repair and installation of machinery and equipment decreased.
In July 2010 compared to June, the seasonally adjusted industrial production increased 5%, the production of manufacturing also grew 5%.
In July 2010 compared to July 2009, the production of electricity increased 72% and the production of heat decreased 8%. The increase in energy production was mainly caused by a growing demand for energy induced by more active manufacturing as well as by the growth in the exports of electricity.
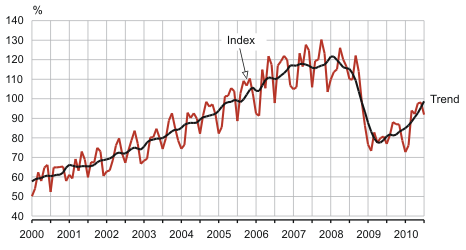
The volume index and trend of production in manufacturing, January 2000 – July 2010 (2005 = 100)
| Economic activity | change compared to the previous month according to seasonally adjusted dataa | change compared to the corresponding month of the previous year | |
|---|---|---|---|
| according to unadjusted data | according to working-day adjusted datab | ||
| TOTAL | 5.2 | 21.3 | 24.6 |
| Energy production | 1.6 | 51.5 | 51.5 |
| Mining | 8.4 | 25.6 | 27.6 |
| Manufacturing | 5.2 | 19.5 | 23.0 |
| manufacture of food products | -0.2 | -1.9 | -0.1 |
| manufacture of beverages | 7.5 | -4.4 | -1.6 |
| manufacture of wood and wood products | 6.6 | 34.4 | 37.8 |
| manufacture of fabricated metal products | -5.6 | -21.9 | -19.0 |
| manufacture of computer, electronic and optical products | 40.5 | 327.8 | 341.0 |
| manufacture of electrical equipment | 0.6 | -2.0 | 1.7 |
| manufacture of chemicals and chemical products | -1.9 | 8.8 | 12.1 |
| manufacture of motor vehicles | 9.5 | 0.2 | 6.5 |
| manufacture of rubber and plastic products | 0.2 | 14.2 | 18.9 |
| manufacture of building materials | 4.8 | 16.2 | 19.6 |
a In case of the seasonally adjusted volume index, the impact of the differing numbers of working days in a month and seasonally recurring factors has been eliminated. It is calculated only in comparison with the previous period.
b In case of the working-day adjusted volume index, the impact of the differing number of working days in a month has been eliminated. It is calculated only in comparison with the corresponding period of the previous year.