Last year the biggest downfall of the GDP was recorded in the 2nd quarter
2009
In 2009 the GDP at current prices was 214.8 billion kroons.
In 2009, the domestic demand decreased approximately by 24%, including households’ final consumption expenditures by 19% and gross fixed capital formation by 35%. The change in inventories decreased fast as well. The share of the domestic demand in the GDP was 95%. The domestic demand was annually less than the GDP for the first time in the last 15 years, i.e. despite the fast decrease the GDP was still bigger than the sum total of final consumption expenditures, investments and changes in inventories. The decrease in households final consumption expenditures was most influenced by the decrease in expenditures on transport, recreation and culture, restaurants and hotels and on miscellaneous goods and services (e.g. on financial services, personal care, etc). The decrease in gross fixed capital formation was most influenced by the decrease in investments in machinery and equipment by the non-financial corporations’ sector.
Along with the decrease in domestic demand import of goods and services decreased as well in real terms (by 27%). The decrease in imports of chemicals and chemical products and food products and beverages, as well as the increase in imports of petroleum products and fuel influenced import the most.
The value added decreased in the majority of economic activities in 2009. It increased only in forestry, fishing and in public administration and defence, but the share of these activities in gross value added of the economy was small. The value added decreased the most in construction, financial intermediation and in manufacturing, whereas the decrease in the value added in manufacturing and wholesale and retail trade had the biggest influence on the decrease in the GDP. Weak domestic demand was the main reason for the bad result of the wholesale and retail trade. Weak domestic demand together with the decrease in domestic orders and worsened external demand contributed the most to the decrease in the value added of the manufacturing. Due to the worsened external demand exports of manufacturing activities steeply diminished.
In 2009, exports of goods and services of the total economy decreased by 11%, including exports of goods by 12% and exports of services by 10%. The decrease in exports was most influenced by the decrease in exports of electrical machinery and apparatus and wood and products of wood. At the same time, the increase in exports of petroleum products and fuels after inward processing had the positive effect.
In 2009, foreign trade balance improved in Estonia. The share of net export in the GDP was 5.4%, being the best indicator annually of the last 15 years. The share of net export in the GDP turned into positive indicator as of the 1st quarter 2009.
4th quarter 2009
Compared to the 3rd quarter, the seasonally and working-day adjusted GDP increased by 2.5% in the 4th quarter. The seasonally and working-day adjusted GDP grew last in the 4th quarter of 2007.
The decrease of the domestic demand decelerated to 17% in the 4th quarter of 2009 (in the 3rd quarter the domestic demand decreased by 28%), influenced to a great extent by the abrupt deceleration of the decrease in inventories in previous year prices. The volume of inventories was influenced by the stocking up of excise goods (especially of tobacco products) by corporations before the rise of excise taxes since the 1st January 2010. Stocking up of excise goods brought about substantially bigger receipts of excise taxes than customary, contributing to the deceleration of the decrease in the GDP.
Households’ final consumption expenditures decreased by 17% (by 20% in the 3rd quarter) and gross fixed capital formation decreased by 35% (by 37% in the 3rd quarter). The decrease in the expenditures on transport and miscellaneous goods and services (e.g. financial services, personal care, etc.) influenced the decrease in the households’ final consumption expenditures most. The decrease in gross fixed capital formation was mostly influenced by the decrease in investments by the non-financial corporations’ sector.
Along with the decrease in domestic demand imports of goods and services decreased as well in real terms (by 22%). At the same time, the decrease in imports has decelerated since the 2nd quarter of 2009. In the 4th quarter the decrease in imports of chemicals and chemical products, petroleum products and fuel and food products and beverages influenced imports the most.
In the 4th quarter the gross value added of most economic activities decreased. The decline was the biggest in construction, hotels and restaurants and in financial intermediation (by -26%, -23% and -21%, respectively). The value added increased in forestry, fishing, mining and quarrying, and in public administration and defence, but the share of these economic activities in the gross value added of the economy was small. The decrease of the gross value added decelerated to 10.7%, affected to a great extent by the decrease of the value added in manufacturing. If in the 3rd quarter the value added in manufacturing decreased by 27%, then in the 4th quarter by 14%. The deceleration of the falling trend of the value added in manufacturing was contributed by the slight increase in exports of this economic activity. At the same time one of the reasons for the improvement of the situation was also lower reference base of the 4th quarter of 2008.
In the 4th quarter, exports of goods and services decreased by 8% in real terms, of which exports of goods by 6% and exports of services by 12%. Exports decreased most in the 1st quarter of 2009, after that export has gradually improved. In the 4th quarter, export of goods was most influenced by the decrease in exports of electrical machinery and apparatus, wood and wood products and food products and beverages. At the same time, the increase in exports of petroleum products and fuels after inward processing had the positive effect.
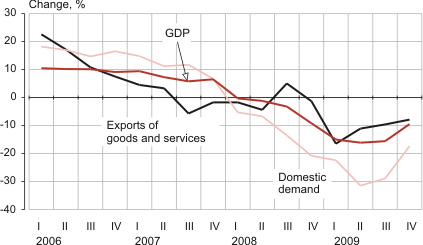
Real growth of the GDP compared to the same quarter of the previous year, 1st quarter 2006 – 4th quarter 2009