
Does Estonia need European statistics? Yes, because having data on Estonia alone is not enough
European Statistics Day is celebrated on 20 October. This is a good moment to reiterate that by fulfilling its statistical obligations and contributing to European statistics Estonia also creates value for itself. When we hear the words “European statistics”, our first thought may be that Estonia collects data and then sends the data to Brussels. In fact, the European Statistical System provides something that Estonia cannot get from just our own data – a point of reference.
There is much value in the knowledge that the unemployment rate in Estonia was 6.6% in the second quarter of 2026, or that prices in September were 3.5% higher than in the same month a year ago. But we need comparative data on other countries to assess whether our indicators are exceptional or normal, whether the changes in Estonia are faster or slower than in other countries, and what we could learn from other countries’ experience.
For a small country, comparisons are especially valuable. With a population of just 1.3 million, Estonia cannot always rely on its own experience when making decisions. The 27 European Union (EU) countries provide a much wider frame of reference.
How much is “a lot”?
Let’s take prices, for example. Every Estonian resident feels the impact of inflation as they pay for groceries, petrol or electricity. Statistics Estonia measures the change in consumer prices in Estonia, while European-level comparisons are based on the harmonised index of consumer prices (HICP), which is calculated in all Member States with the same methodology. It is the HICP which enables us to actually see whether prices in Estonia are rising faster than in Latvia, in Finland or in the EU on average.
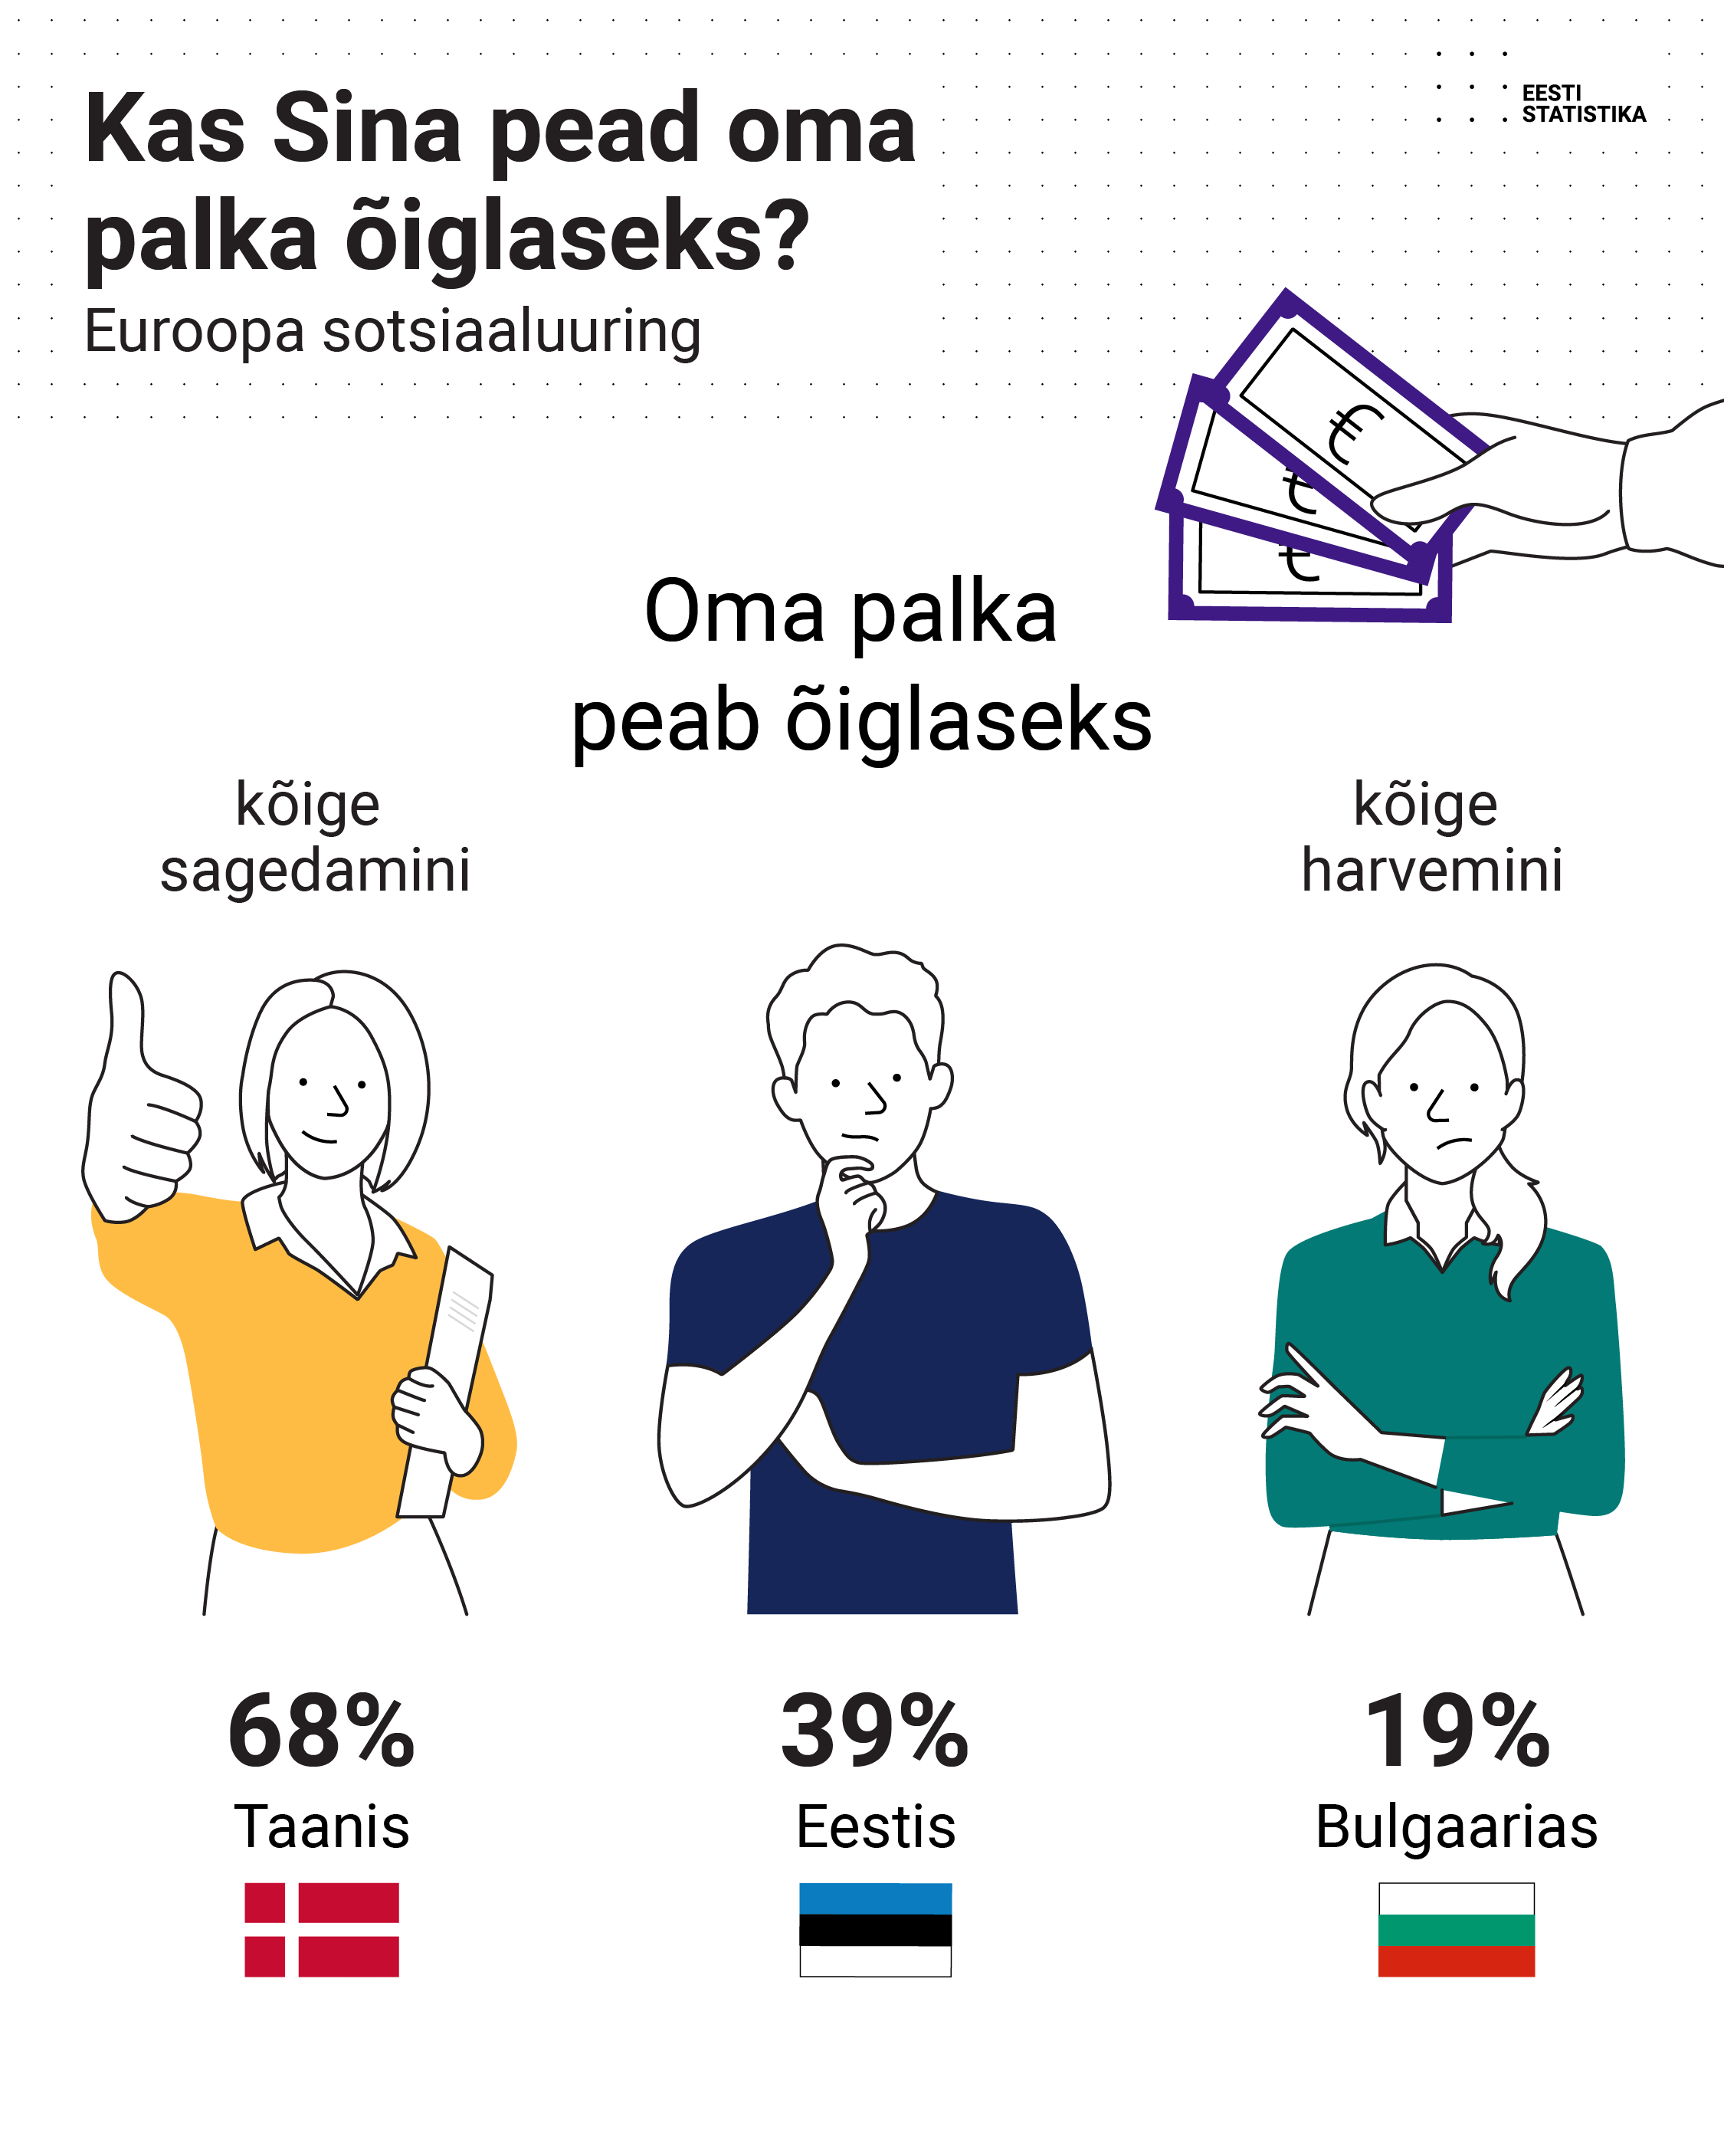
Based on data from Eurostat, the statistical office of the European Union, we can compare inflation and price levels across Europe and understand purchasing power. Having the same wages does not always mean having the same standard of living, as the prices of goods and services vary considerably between countries. According to Eurostat, in 2025, price levels for household consumption in EU countries ranged from 63% to 140% of the EU average. In Estonia, the price level for household consumption was 101% of the EU average. Such comparisons show why purchasing power may vary greatly in Europe for people with the same amount of income.
The same applies to wages and salaries, unemployment, poverty, education, demographic trends and economic growth – we produce data about Estonia, and the international comparison puts the data into context.
European statistics show where Estonia has made real progress
Sometimes we judge Estonia’s growth mostly in reference to the situation a year ago. We might get quite a different picture by looking at longer periods and other countries as well.
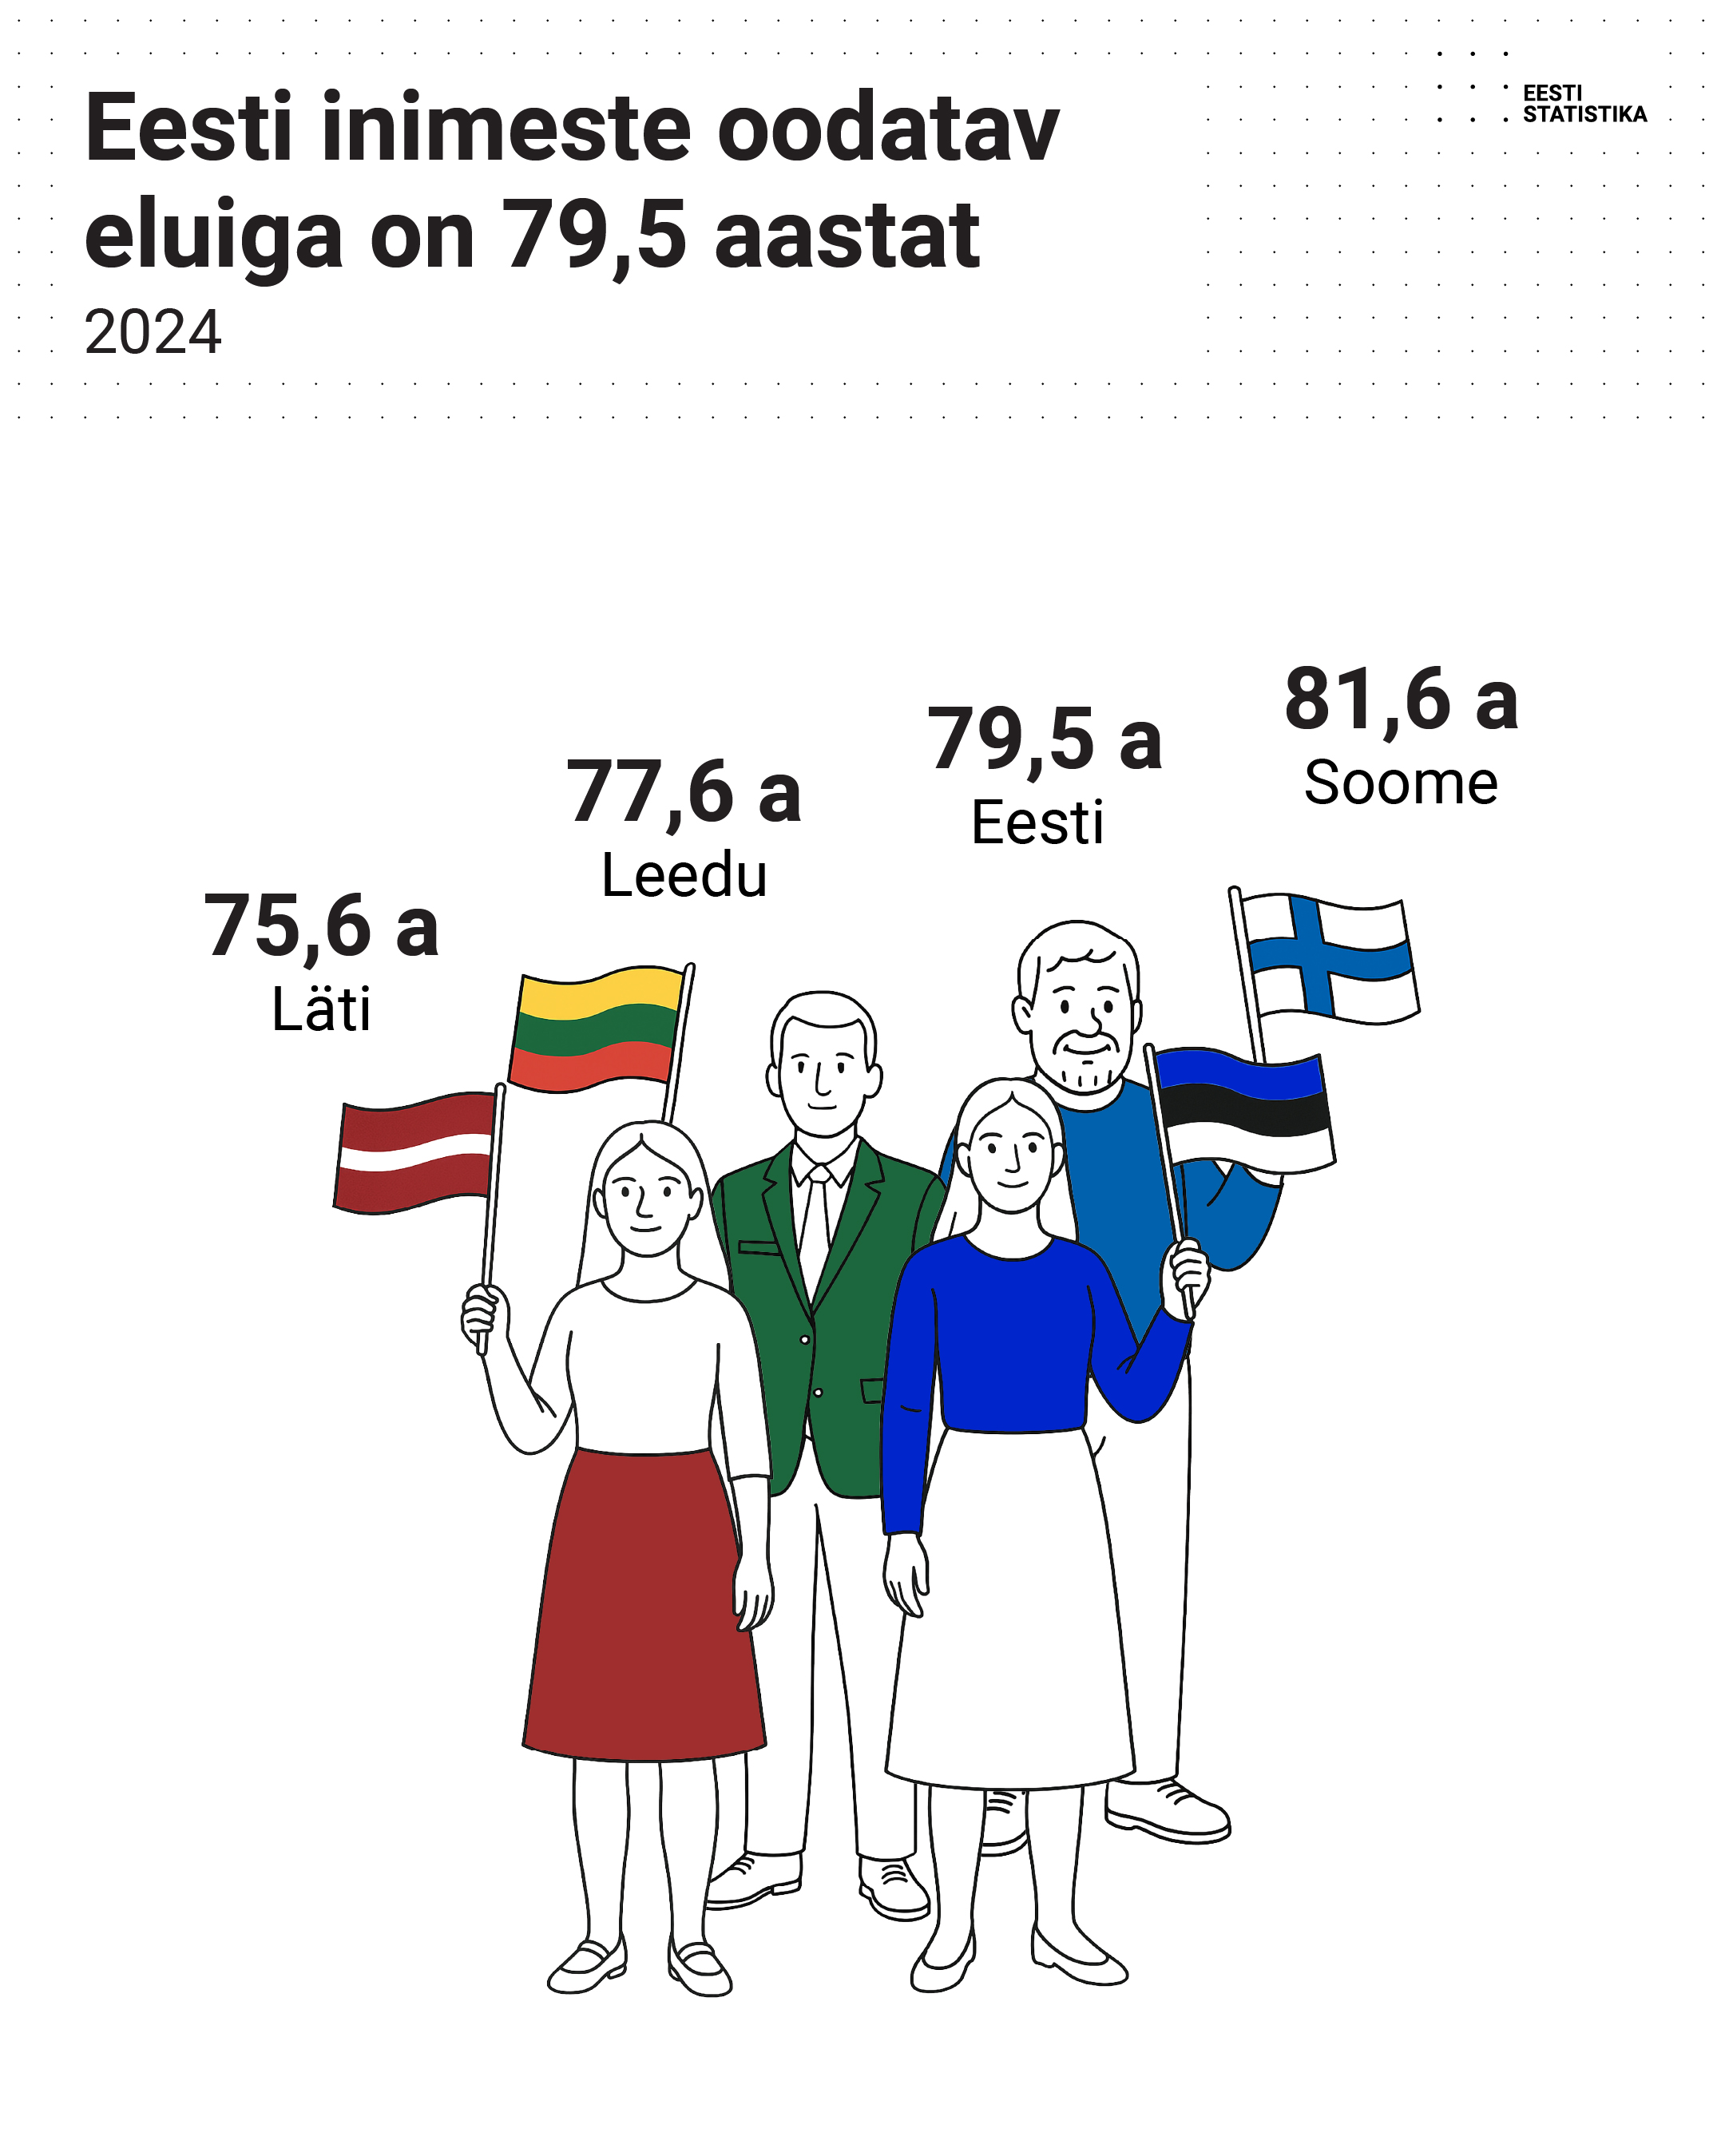
In this respect, life expectancy is a good example. In 2024, the average life expectancy in the European Union was 81.5 years. Estonia still has some way to go to catch up with the top countries in Europe, but the long-term trend shows remarkable progress. In the years 2004–2024, life expectancy in Estonia increased by seven years – more than in any other EU country.
Without any data on other European countries, we would still know that life expectancy in Estonia has increased, but the comparative data for Europe tell us how rapid the developments have been and how far we still have to go.
Funding decisions are based on data
European statistics are not only used for interesting tables and graphs. The data are used in decision-making, and sometimes they have a direct bearing on the distribution of EU funding.
For example, in case of the EU’s Cohesion Fund, allocations are based on regional GDP per inhabitant compared to the EU average. During the period 2021–2027, the key criterion for determining the eligibility of regions for funding is whether regional GDP per inhabitant is less than 75% of the EU average. The additional criteria used include youth unemployment, education levels, indicators related to climate change, and impact of migration.
Thus, Estonia’s GDP must be calculated in a way that allows comparisons with other European countries, be it Portugal, Poland, Germany or Finland. This is achieved through the use of common definitions and methodologies. Estonia has produced internationally comparable national accounts time series back to the year 1995.
European statistics are also used for economic forecasting, for labour market, social and regional policies, for budget planning and for many other decisions.
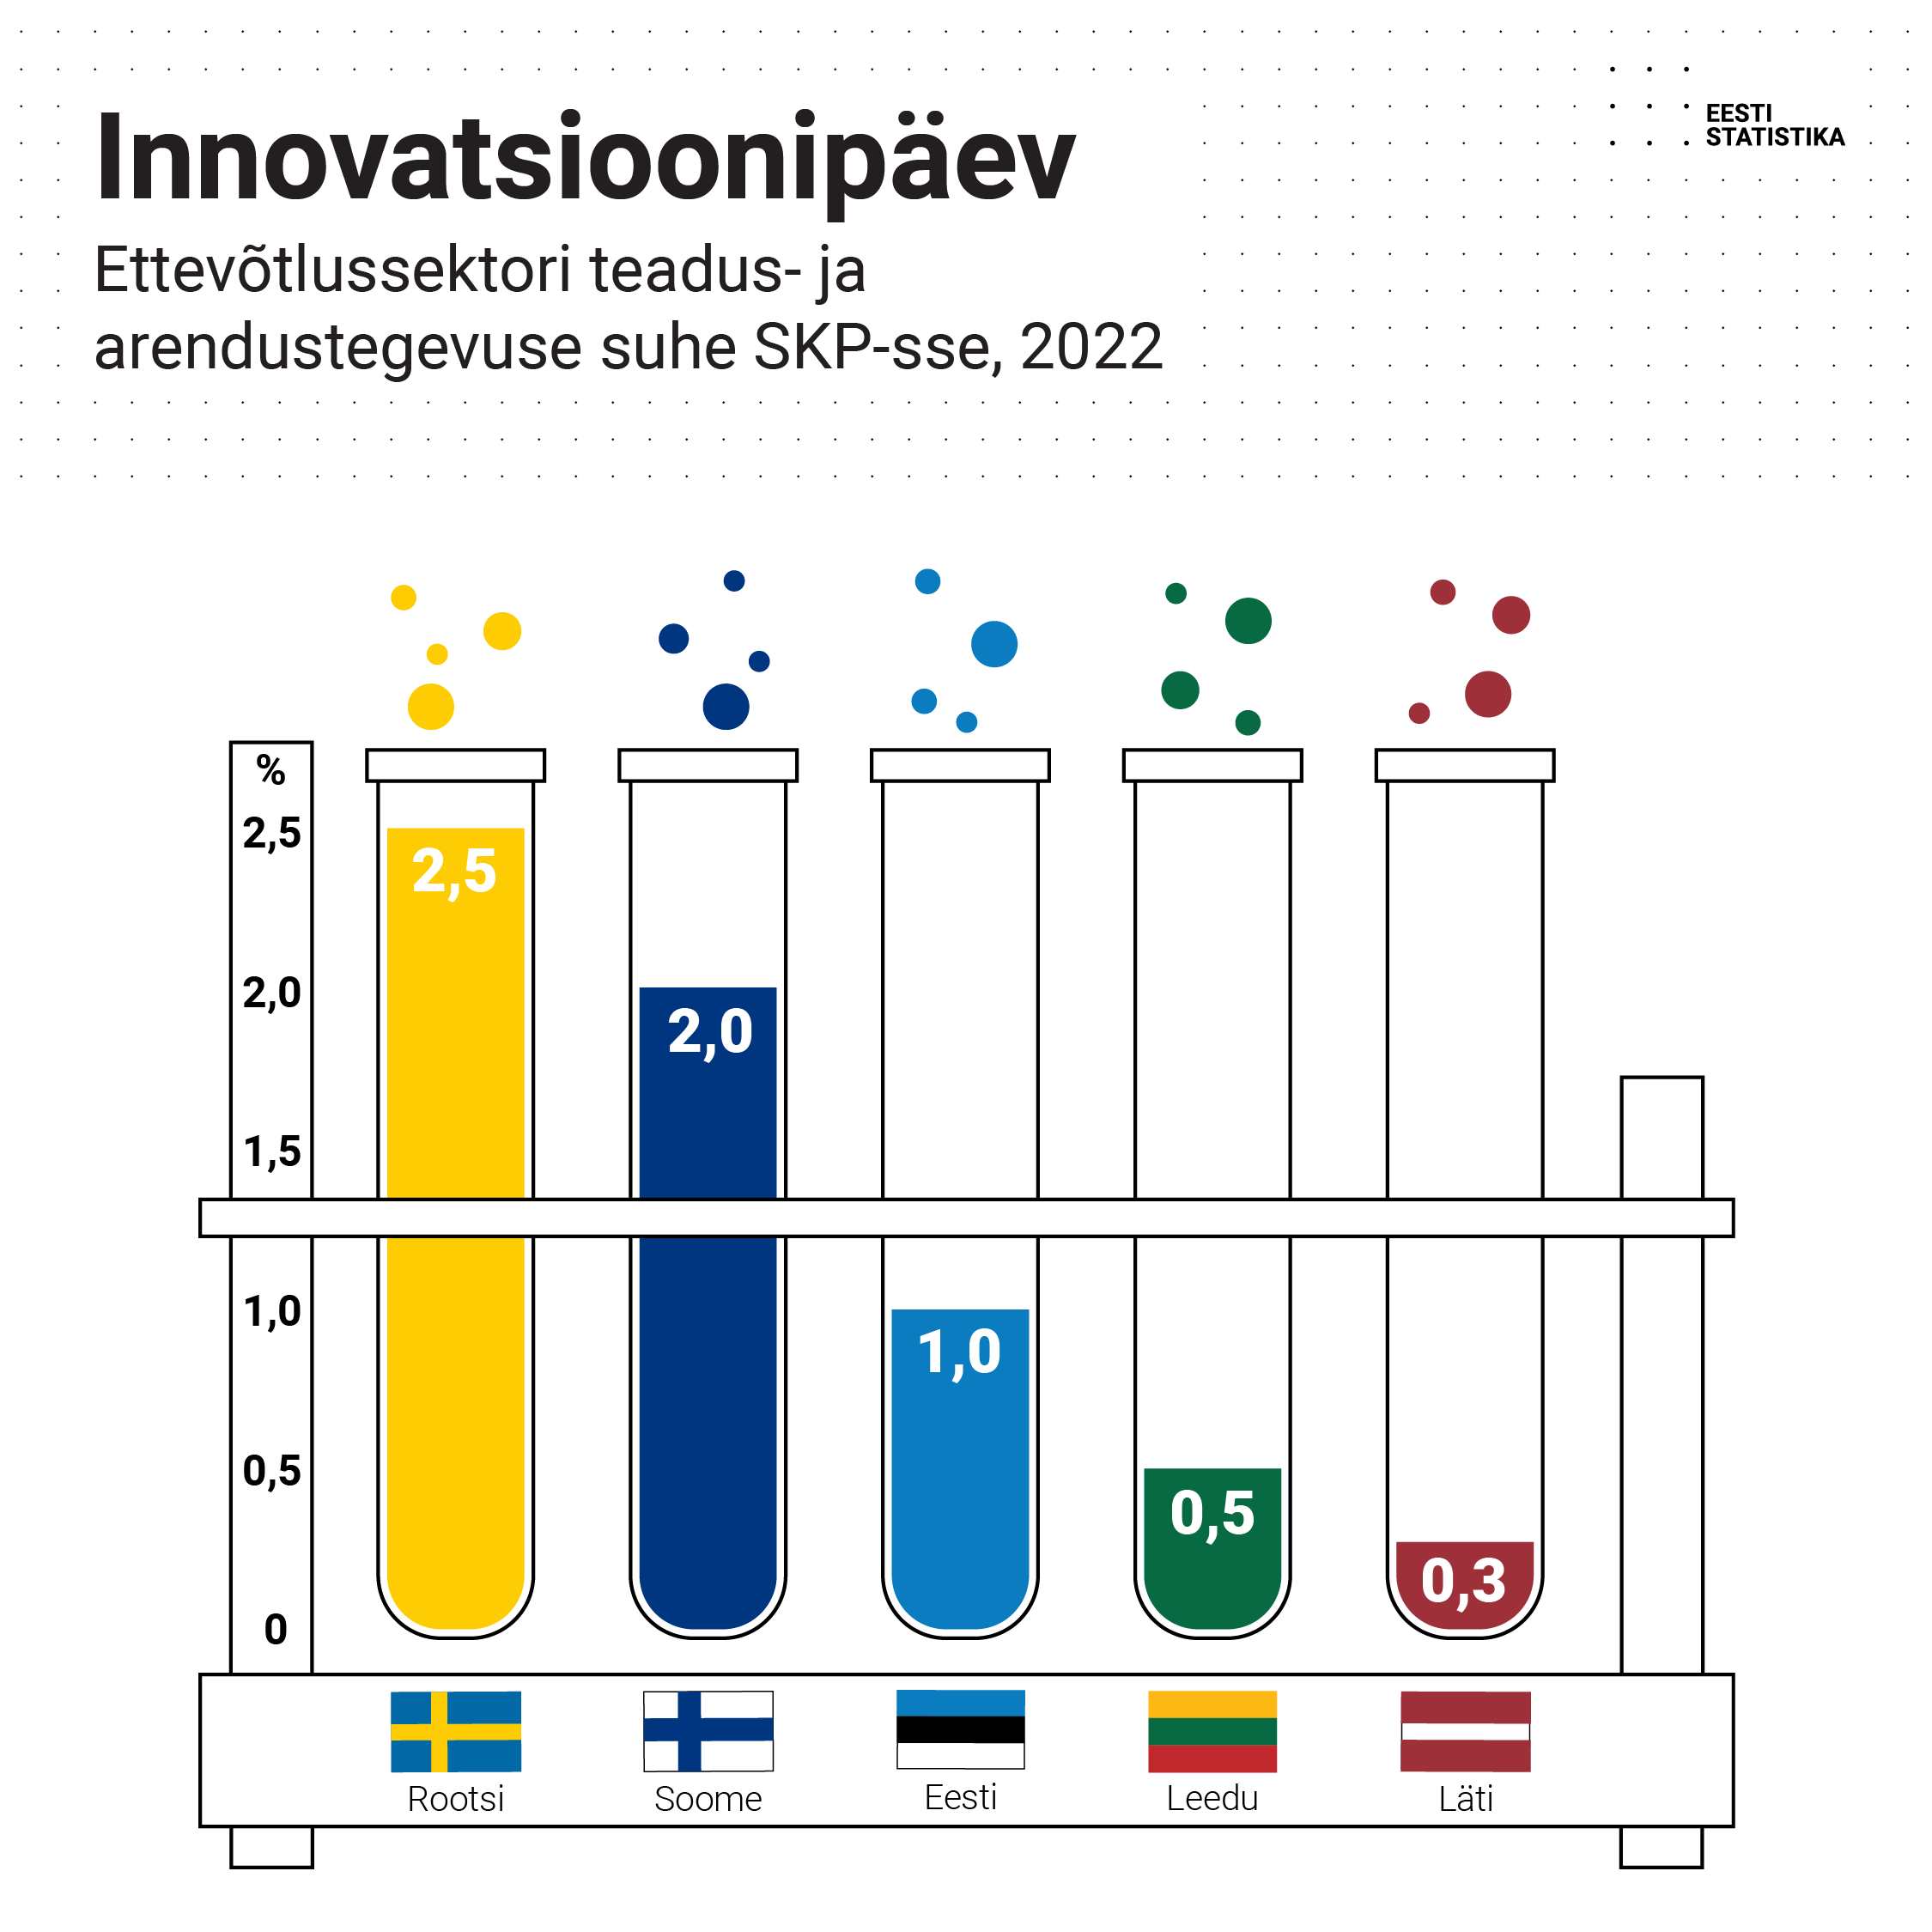
But why does Estonia have to provide so much data to Europe?
It is a justified question. The production of statistics should not mean that enterprises and individuals have to fill in countless questionnaires just because somebody somewhere would like to see another table published.
The underlying principle of the European Statistical System is the opposite of that: the countries agree on common definitions, methodologies and quality requirements, so that we would not measure the same thing in 27 completely different ways. The national statistical institutes collect and validate the bulk of the base data for European statistics. Eurostat then aggregates the data and performs additional quality checks to release comparable European statistics.
In this process, Estonia has a clear goal: to obtain the necessary statistics with the minimum burden. Increasingly, this means obtaining data from existing registers and other sources. The aim is not to ask enterprises or individuals to provide information which the state has already recorded somewhere.
European statistics are Estonian statistics
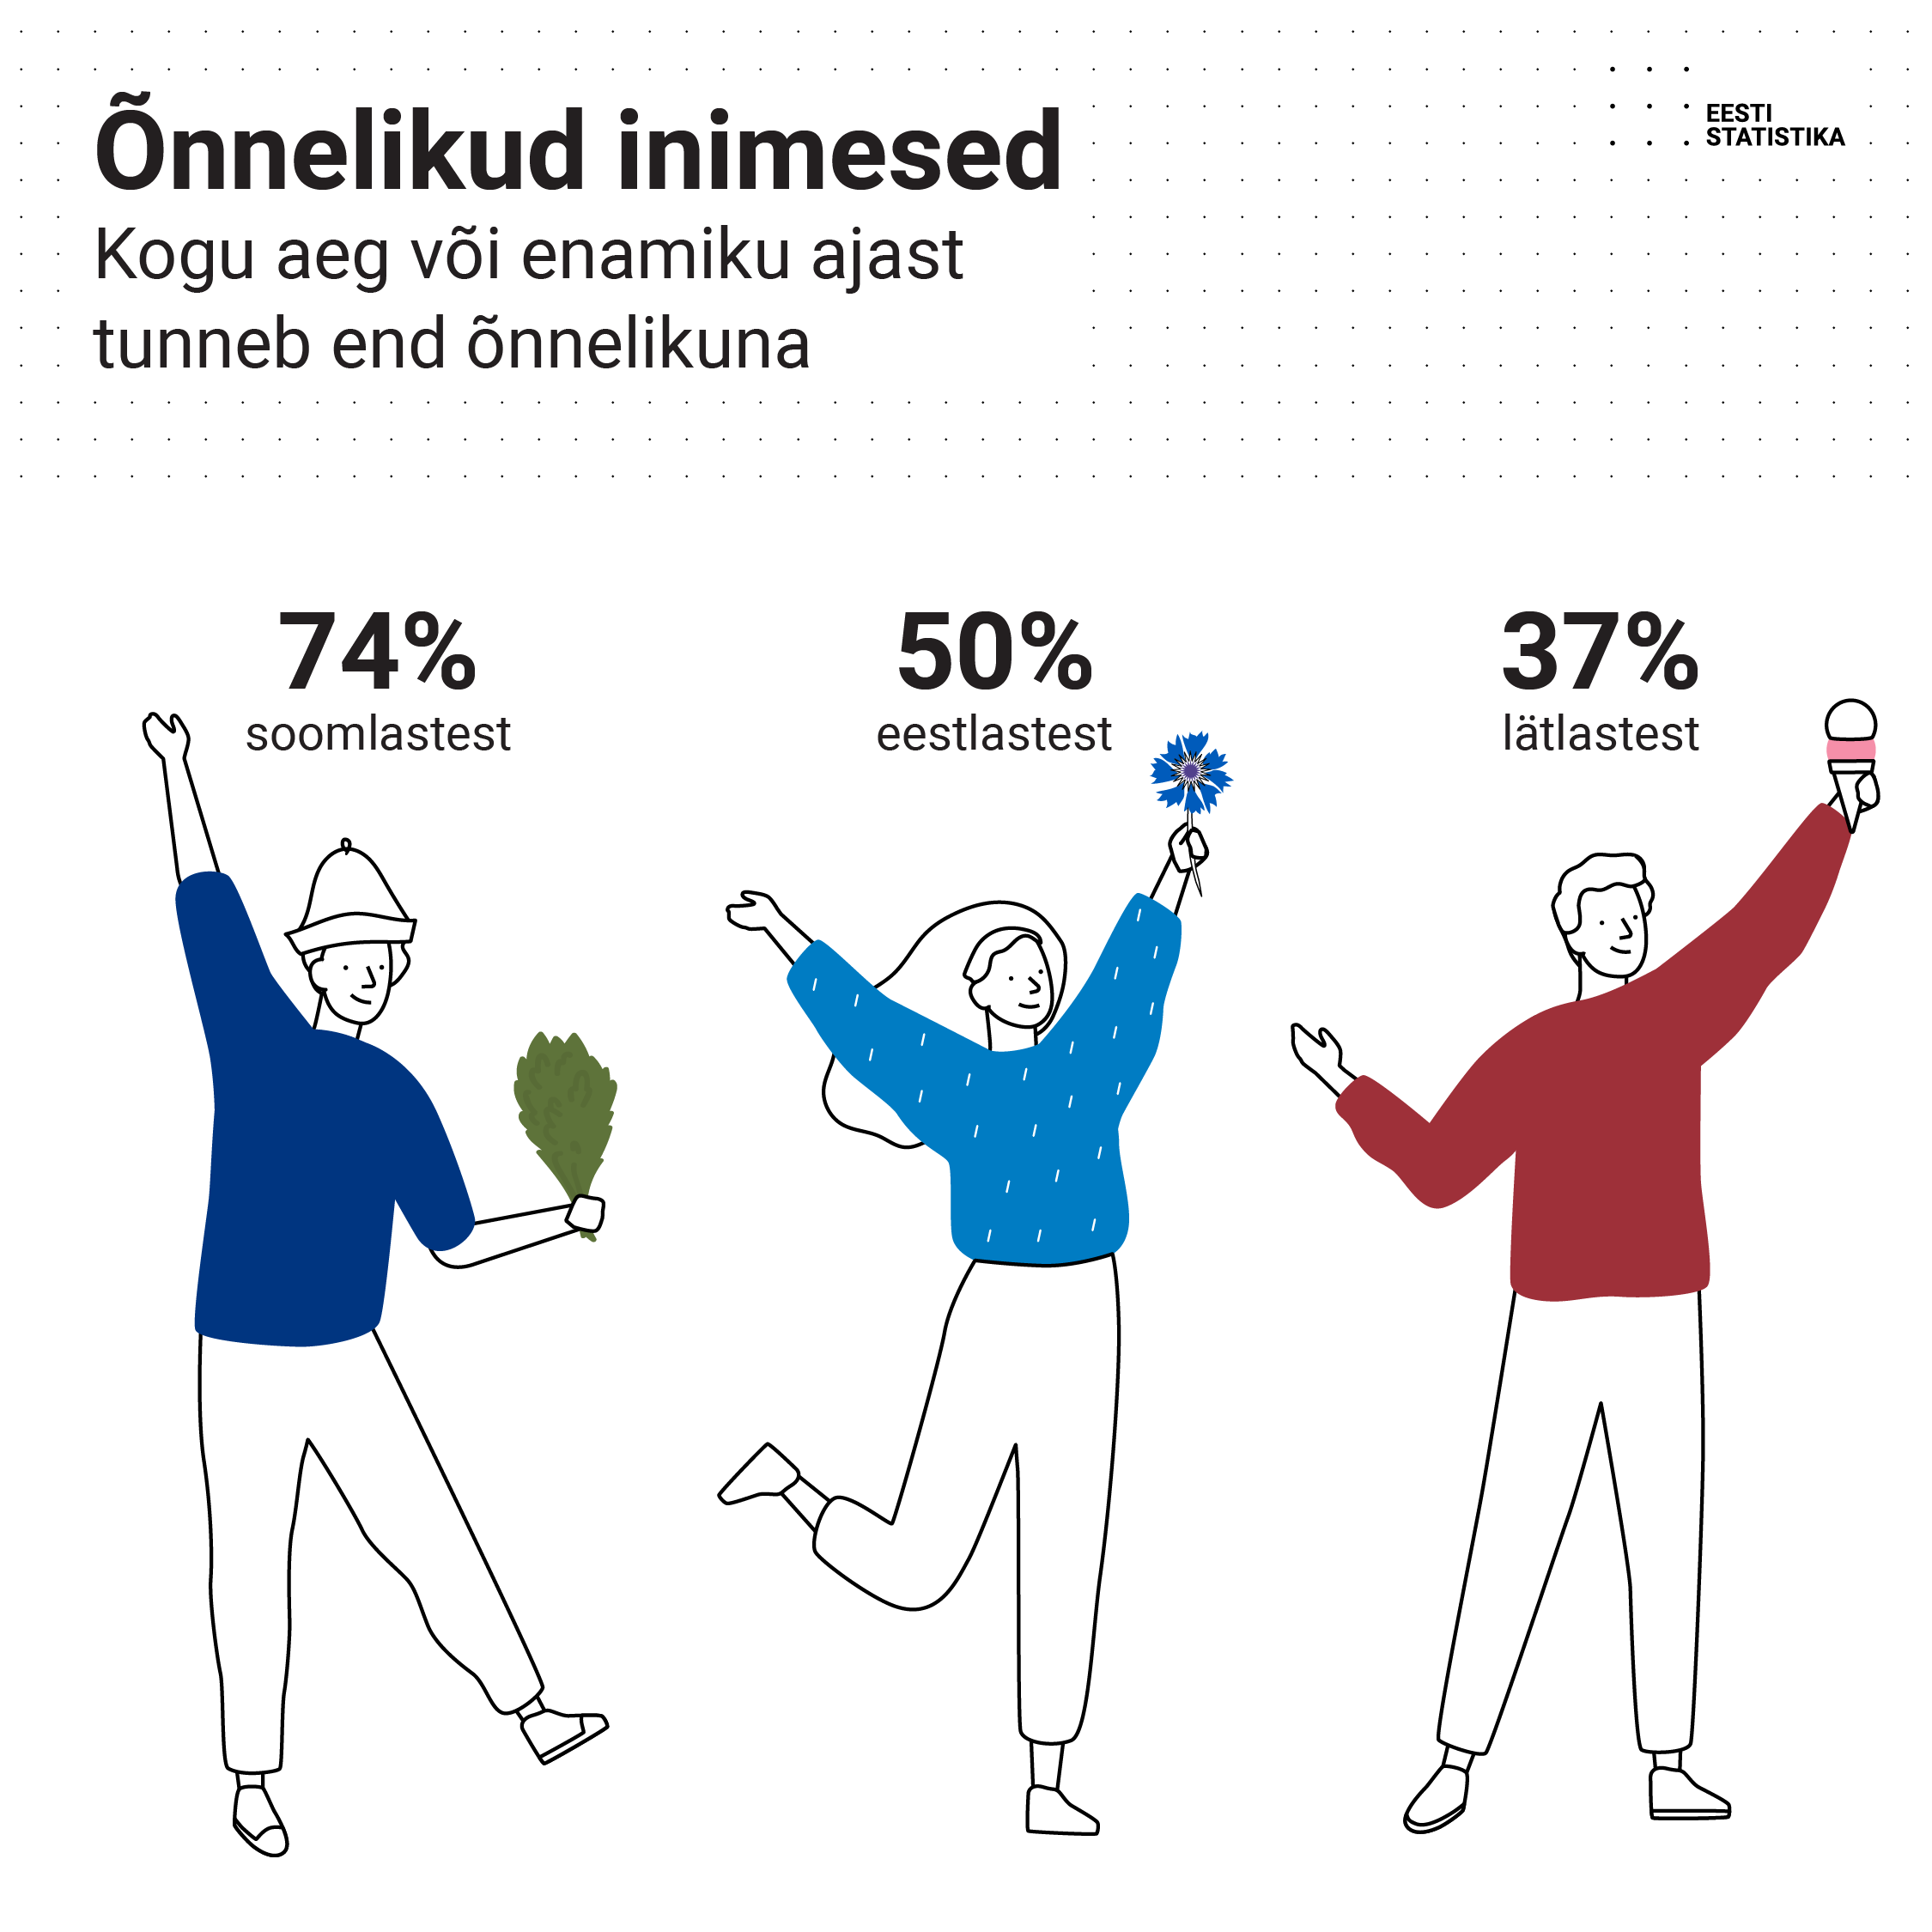
The European Statistical System serves as a kind of reference laboratory with input from 27 countries. We can study retirement and health policies in the context of ageing societies, or which countries have good conditions for business or have managed to reduce poverty or unemployment, or how the Estonian economy compares to our neighbouring countries. Estonian researchers can then study the factors behind the negative and positive trends of specific indicators, and policymakers in Estonia can decide on ways to improve the situation, if necessary.
Reliable statistics can show us where we are now. Comparable European statistics help us understand whether we have done enough and what we should be aiming for next.
For further information:
Annaliisa Köss
Media Relations Partner
Marketing and Dissemination Department
Statistics Estonia
Tel +372 5696 6484
press [at] stat.ee (press[at]stat[dot]ee)